Download
1 / 16
160 likes | 167 Views
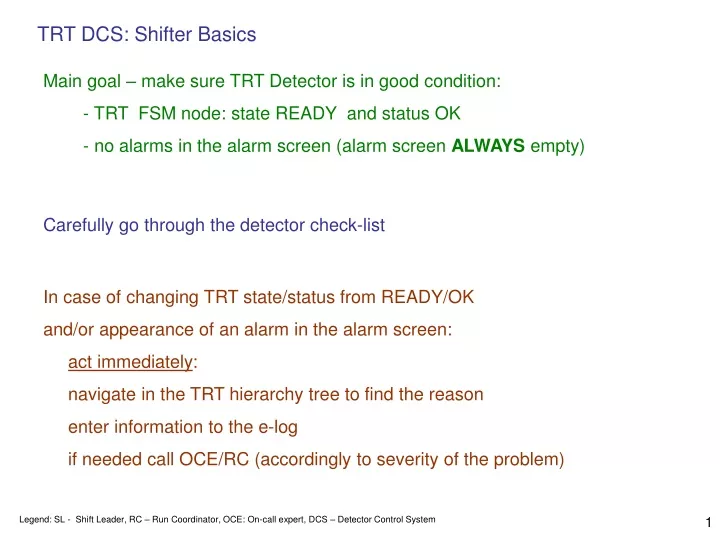
TRT DCS: Shifter Basics. Main goal – make sure TRT Detector is in good condition: - TRT FSM node: state READY and status OK - no alarms in the alarm screen (alarm screen ALWAYS empty). Carefully go through the detector check-list.

E N D
TRT DCS: Shifter Basics Main goal – make sure TRT Detector is in good condition: - TRT FSM node: state READY and status OK - no alarms in the alarm screen (alarm screen ALWAYS empty) Carefully go through the detector check-list In case of changing TRT state/status from READY/OK and/or appearance of an alarm in the alarm screen: act immediately: navigate in the TRT hierarchy tree to find the reason enter information to the e-log if needed call OCE/RC (accordingly to severity of the problem) Legend: SL - Shift Leader, RC – Run Coordinator, OCE: On-call expert, DCS – Detector Control System
In the beginning of your shift: 1. Check setup of the TRT console in ACR: TRT Desktop 1 Screen III and Screen IV should contain: Screen IV: FSM Panel Screen III: Alarm Panel 2. Login to FSM and to Alarm panels using your nice credentials: FSM Panel Alarm Panel: Left click on key icon the login dialog will be opened: At the end of your shift: logout from both panels by right-click on key icon and choosing Log out from the popup menu
Short Overview of TRT DCS • Basics of FSM: this slide • TRT Hierarchy: slide 4, 10-12 • FSM: ways of navigation, monitoring and control: slides 5-9 • TRT Infrastructure: slides 13-14 • Alarm screen: slides 15-16 ATLAS FSM Architecture (slide from Central DCS Manual) Control Unit CU: a part of tree, can be excluded, included, taken; contains children of any type – an independent process CUs Logical Unit LU: bottom level of a tree, can be enabled, disabled, can contain other LUs or DUs – an object within a process CUs/LUs Device Unit DU: “real” device in PVSS, can be enabled, disabled, cannot have children DUs The detector is broken down into finite state machine units that are hierarchically controlled by other FSMs. Each unit reacts on changes of the internal status of the individual device or groups of devices it is representing and allow simplified control, error handling and interaction with other detector components in the hierarchy. Each unit is descirbed by its STATE and STATUS. STATEs and STATUSes are transferred up in the hierarchy, while commands – down.
TRT Hierarchical Structure TRT DAQ Partitions Commands INFRASTRUCTURE ENDCAP C BARRELC BARREL A ENDCAP A RACKS HV HV HV HV COOLING FE_LV FE_LV FE_LV FE_LV DAQ VME TEMP TEMP TEMP TEMP LV BULK CANPSU HWI States/Statuses ALARMS Comments GAS there is ONE HV for Barrel, it is visible from both sides: C and side A GG SS GGSS (Gas Gain Stabilization System) regulates voltage level of HV
TRT FSM Panel Navigation Part FSM Hierarchy Fast Navigation FSM Status Messages left click: open Main Panel right click: open Secondary Panel Parameter Widget left click: start FSM command Whether all PVSS systems in TRT are connected. Any missing: red background Whether all PVSS systems in TRT are connected. Any missing: red background Secondary Panel Main Panel Control Widget
NOT_READY UNKNOWN OK SHUTDOWN TRANSITION WARNING ERROR FATAL READY FSM Hierarchy: STATE, STATUS and Tree CONTROL STATE STATUS Tree Control Tree Control Logical Units & Device Units: Control Units – padlocks: enabled disabled Basic TRT States: Background colours of padlock/device control: grey: FSM tree is complete orange: FSM tree incomplete, part of a tree is excluded and locked out yellow: FSM tree incomplete, individual devices disabled Obligatory (and the only) for: TRT node and DAQ Partitions nodes Yellow backgrounds are connected with disabled hardware (HV lines or LV FE boards) – should match exactly information posted in the White Board. Available statuses: Everything is fine ANY orange background shows a problem Low severity, the system can go on working, to fix in the following working hours High severity, serious error, to be fixed ASAP, contact DCS OCE or RC Very high severity, the system cannot work. Immediate action: inform SL, RC, DCS OCE Legend: SL - Shift Leader, RC – Run Coordinator, OCE: On-call expert, DCS – Detector Control System
Navigation through the hierarchy General rule: Left mouse click on Control mentioned below: navigates to the node described by the control and opens its Main Panel. Right mouse click: opens its Secondary Panel without changing navigation. 1. FSM hierarchy tree • How to start a command: • Left click on a state field of a node • When command name is shown choose it • Then a confirmation window appears: choose YES or NO Navigation part Command part 2. Subsystems in Fast Navigation 3. Control Widget This is a graphical representation of an FSM node within the detector granularity: any of a plane figure (e.g. a polygon, a circle ), with a circle inside it. Background colour of the figure shows the node state. Background colour of the inside circle shows the node status. When you move your mouse over that shape, a pointer (small finger) and a tooltip describing control name is shown. Then just press Left or Right mouse button. A simplified and fast version of the navigation. This panel is present always on the FSM screen and is fixed. It consits of 4 columns containg DAQ partitions, each consisting of 3 subsystems: HV – High Voltage, LV – Front End Low Voltage and Temperature and of 8 members of Infrastructure (overview on p. 9,10). Background colour of letters describing subsystems show their state, where status is shown by two letters on the right: OK, W, ERR, F and subsequent background colour.
Displaying data Background colour of a Parameter Widget contains an information: This background colour is shown, if there is no alarm connected to the value If an alarm is connected to the value, the background colour can be on of: green: the value is in valid range yellow: WARNING limit was exceeded, usually (but not always) connnected with WARNING STATUS orange: ERROR limit was exceed, is connected with ERROR STATUS red: FATAL limit was exceeded, is connected with FATAL STATUS grey: an alarm needs to be acknowledged, as source of the alarm dissappeared dark grey: bad (invalid) value Right Click on any Parameter Widget shows a trend of its value: if a parameter is stored in the DB, the view is like on a picture below. if not: there is no line, only current value is shown. On some panels left click on the following buttons opens an independent page with trends: Several trends for Cooling systems Plot of a spectrum in GGSS
Some hints on displaying trends • Moving mouse show tooltip text: • over Y (value) axis • over X (time) axis • over value (datapoint) name 1 2 3 Menu: Time Range allow display pre-chosen time interval or jump into any moment in the history 1:1 unzoom both axis Keeping pressed left- mouse button while moving allows for dynamic zoom Left mouse click on any part of trend area opens a ruler window. Then moving the ruler line shows value in the window.
TRT Basic Granularity End Cap: LV and some Temperature Groups: 32 units HV: 16 units – marked with magenta lines Barrel: LV, HV, some Temperature Groups HV: S3S4 2 (side A) (side C) 2 2 (side A) 1 (side A) (side C) 2 (side C) 1 1 (side A) (side C) 1 32 (side A) (side C) 32 (side C) 32 32 (side A) • 32 units, called: • DCS Slice - when controlling 1/32 of both End Cap and Barrel: used in LV system • Barrel / End Cap Readout Stack – when controlling 1/32 of either Barrel or End Cap, used in LV and some groups of Temperature • Barrel HV Stacks – when controlling 1/32 of Barrel: used in HV system • 16 units, called: • HV End Cap Double-Sector (e.g. S3S4)– when controlling End Cap HV (signed in magenta on right picture) Temperature Groups, divided by roles. Lower granularity depends on either type on controlled hardware or a detector part. The detailed description is placed in:DESCRIPTION OF TRT DCS FOR SHIFTERS
TRT Basic Granularity: temperature groups Temperatures are grouped by their role: BARREL FE Electronics, Cooling Plates, Detector Sensors and CO2 Ventilation ENDCAP FE Electronics, Electronics Cooling, Straw Cooling, Mechanics and Environment
TRT Basic Granularity: HV, LV System and Temperature Systems The status and state of HV and LV systems is shown in different places with different granularity. Also there are some TRT-dedicated states on lower levels, with meaning, name and colour dedicated to subsystem Subsystems in Fast Navigation: for entire DAQ Partition: states are shown with colours: States of Temperature States of HV States of LV READY READY READY SAFE_HV UNPREPARED NOT_READY RAMPING UNKNOWN ALL_OFF PREPARED NOT_READY SHUTDOWN UNKNOWN NOT_READY UNKNOWN Subsystems in Main TRT Panel: for Barrel or EndCap Stack/Sector states are shown with colours: States of HV States of LV States of Temperature READY READY READY SAFE_HV UNPREPARED NOT_READY RAMPING ALL_OFF UNKNOWN PREPARED NOT_READY SHUTDOWN UNKNOWN NOT_READY UNKNOWN
TRT Infrastructure Overview: monitor + control MARATONS BULK DAQ CRATES VME VME Crates containing TRT DAQ electronics. Low Voltage bulk power supplies. 20 MARATON power boxes, housing 12 independent power supply channels each. 40 channels used for powering PP2 boxes, 192 channels used for Front End electronic supply . Shifter: no action Shifter: EMERGENCY action: CAN BUSES PSUs CAN GGSS GGSS Gas Gain Stabilization System: basic overview of the system functions as well as the display of Fe-55 spectra collected on different detectors within the GGSS monitoring boxes. Shifter: no action Shifter: no action ATLAS Standard power supplies, for CANBUS and ELMBs. Legend: Node name in Fast Navigation FSM NODE Node name in Navigation Part FN
TRT Infrastructure Overview: monitor COOLING COOL RACKS Information from Central DCS CIC (Common Infrastructure) on TRT racks in USA15. Racks in row 14: 23 – 27 LV 28 – 30 HV Racks in row 11: 22 – 26 DAQ 27 – 29 DCS PCs, CANPSU and HWI Information about FE electronics and cable cooling stations. There is also a table with the temperatures of all TRT racks in USA15 as well as of cooling water for racks and UX level8 maraton power supplies. HWI HWI ALARMS ALs GAS GAS HWI – Hardware Interlock System automatically switches off LV Maraton Bulks in case of: over temperature in any of FE electronic card on the detector lack of supply voltage in any of PP2 boxes Information from 2 external systems: DSS - Detector Safety System and CIC. DSS monitors cooling of FE, cabling, racks, power failure and activation of UPS. CIC data show status of leak sensors in Maraton LV racks located in UX. Monitoring of TRT Active Gas Legend: Node name in Fast Navigation FSM NODE Node name in Navigation Part FN
Alarm Screen All Alarms coming from TRT detector are shown in the alarm screen. If an alarm occurs, its information appears immediately in the alarm screen, with severity described in the first column: with a letter in appropriate colour: F – fatal – red, E – error – orange, W – warning – yellow and other information in further columns. There are 2 types of alarms: - requiring acknowledgement: after source of an alarm dissappears, the alarm is not removed automatically from the alarm screen, but an action of an operator (shifter or expert) is expected. - without acknowledgement: after source of an alarm dissappears, the alarm is automatically removed from the alarm screen or an alarm can be acknowledged individually here (double click on !!! mark) Several alarms can be acknowledged here (choose one option in submenu) Alarm severity
Alarm Screen - controls Write click on Online Value opens a submenu Dubble click opens a list with available PVSS system and allows to choose systems Display alarms with chosen severity or containing a pattern Login field Press ‘Apply Filter’ button after every change of any part of FILTER (blinking green) Filter Settings