Download
1 / 12
180 likes | 383 Views
Lecture 8 Cost Curves. Short Run and Long Run. Short Run: Short run is defined as a situation where some factors are fixed. Example: in short run production function land can be fixed. That means we cannot change the amount of land in our production process.

E N D
Short Run and Long Run • Short Run: Short run is defined as a situation where some factors are fixed. Example: in short run production function land can be fixed. That means we cannot change the amount of land in our production process. • Long Run: Long run is defined as a situation where all factors are variable. Example: in long run production function we can change the amount of land. That means we can increase or decrease the amount of land that we are using in production process.
Costs in the Short Run • The short run is a period of time for which two conditions hold: • The firm is operating under a fixed scale (fixed factor) of production, and • Firms can neither enter nor exit an industry. • In the short run, all firms have costs that they must bear regardless of their output. These kinds of costs are called fixed costs.
Costs in the Short Run Total Cost = Total Fixed + Total Variable Cost Cost Fixed cost is any cost that does not depend on the firm’s level of output. These costs are incurred even if the firm is producing nothing. Variable cost is a cost that depends on the level of production chosen.
Average Cost Average total cost, often referred to simply as average cost, is total cost divided by quantity of output produced. ATC = TC/Q Average fixed cost is the fixed cost per unit of output. AFC = FC/Q Average variable cost is the variable cost per unit of output. AVC = VC/Q
Short-Run Fixed Cost (Total and Average) of a Hypothetical Firm • AFC falls as output rises; a phenomenon sometimes called spreading overhead.
Variable Costs • The total variable cost is derived from production requirements and input prices. The total variable cost curve is a graph that shows the relationship between total variable cost and the level of a firm’s output.
Total Costs • Thus, the total cost curve has the same shape as the total variable cost curve; it is simply higher by an amount equal to TFC. Adding TFC to TVC means adding the same amount of total fixed cost to every level of total variable cost.
Derivation of Marginal Cost fromTotal Variable Cost Marginal cost measures the additional cost of inputs required to produce each successive unit of output.
The Shape of the Marginal Cost Curve in the Short Run • The fact that in the short run every firm is constrained by some fixed input means that: • The firm faces diminishing returns to variable inputs, and • The firm has limited capacity to produce output. • As a firm approaches that capacity, it becomes increasingly costly to produce successively higher levels of output.
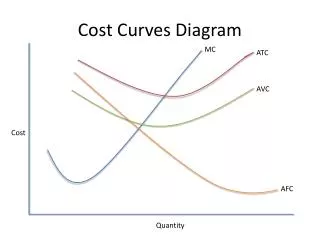
General principles that are always true about a firm’s marginal and average total cost curves: • At the minimum-cost output, average total cost is equal tomarginal cost. • At output less than the minimum-cost output, marginal cost isless thanaverage total cost and average total cost is falling. • And at output greater than the minimum-cost output, marginal cost isgreater thanaverage total cost and average total cost is rising.
The Relationship Between the Average Total Cost and the Marginal Cost Curves