Download
1 / 48
480 likes | 698 Views
Using the Social Network Data From Add Health . James Moody. 2000 Add Health Users Workshop August 1 & 2 Bethesda Maryland. Introduction: What and Why Levels of Network Data Composition & Pattern Networks on both sides of the equation Network Data structures Adjacency Matricies

E N D
Using the Social Network Data From Add Health James Moody 2000 Add Health Users Workshop August 1 & 2 Bethesda Maryland
Introduction: What and Why • Levels of Network Data • Composition & Pattern • Networks on both sides of the equation • Network Data structures • Adjacency Matricies • Adjacency Lists • Network Analysis Programs • Network Data in Add Health • In School Friendship Nominations • In Home Friendship Nominations • Constructing Networks • Total Networks • Local Networks • Peer Groups • Analyses Using Networks • Networks as dependant variables • Networks as independent variables
ego Levels of Network Data Best Friends ego ego Local Network Peer Group
Measuring Network Context Patterns • Pattern measures capture some feature of the distribution of relations across nodes in the network. These include: • Density: % of all possible ties actually made • Reciprocity: likelihood that given a tie from i to j there will also be a tie from j to i. • Transitivity: extent to which friends of friends are aslo friends • Hierarchy: Is there a status order to nominations? How is it patterned? • Clustering: Are there significant groups? How so? • Segregation: Do attributes (such as race) and nominations corespond? • Distance: How many steps separate the average pair of persons in the school? Is this larger or smaller than expected? • Block models: What is the implied role strucutre underlying patterns of relations? • These features (usually) require having nomination data from each person in the network.
Measuring Network Context Composition • Compostion measures capture characteristics of the population of people within a given network level. These include: • Heterogeneity: How dispersed are actors with respect to a given attribute? • Means: What is the mean GPA of ego’s friends? How likely is it that most of ego’s friends will go to college? • Dispersion: What is the age-range of people ego hangs out with? • These features can often be measured from the simple ego network.
Analysis with Social Network data • Networks as Dependant Variables • Interest is in explaining the observed patterns of relations. • Examples: • Why are some schools segregated and others not? • What accounts for differences in hierarchy across schools? • What accounts for homophily in friendship choice? • Tools: • Descriptive tools to capture properties • Standard analysis tools at the level of networks to explain the measures • p* and other specialized network statistical and simulation models
Analysis with Social Network data • Networks as independent Variables • Interest is in explaining behavior with network context (Peer influence/ context models) • Examples: • Is ego’s probability of smoking related to the smoking levels of those he/she hangs out with? (compositional context) • Is the transition to first intercourse affected by the peer context? • Are isolated students more likely to cary weapons to school than those in dense peer groups? (positional context) • Tools: • Depends on dependant variable • Peer influence models • Dyad models • Contextual models, with network level as nested context (students within peer groups)
Network Data Structures 1 2 3 Send 1 1 2 3 4 4 4 4 5 5 5 Recv 2 3 4 2 1 2 3 5 1 3 4 5 4 Adjacency Matrix Graph Arc List Node List
Network Analysis Programs • 1) UCI-NET • Genearl Network analysis program, runs in Windows • Good for computing measures of network topography for single nets • Input-Output of data is a little clunky, but workable. • Not optimal for large networks • Availiable from: • Analytic Technologies • Borgatti@mediaone.net • 2) STRUCTURE • “A General Purpose Network Analysis Program providing Sociometric Indices, Cliques, Structural and Role Equivalence, Density Tables, Contagion, Autonomy, Power and Equilibria In Multiple Network Systems.” • DOS Interface w. somewhat awkward syntax • Great for role and structural equivalance models • Manual is a very nice, substantive, introduction to network methods • Availiable from a link at the INSNA web site: • http://www.heinz.cmu.edu/project/INSNA/soft_inf.html
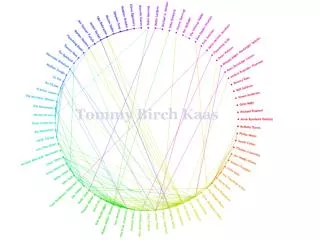
Network Analysis Programs • 3) NEGOPY • Program designed to identify cohesive sub-groups in a network, based on the relative density of ties. • DOS based program, need to have data in arc-list format • Moving the results back into an analysis program is difficult. • Availiable from: • William D. Richards • http://www.sfu.ca/~richards/Pages/negopy.htm • 4) PAJEK • Program for anlayzing and plotting very large networks • Intuitive windows interface • Used for all of the real data plots in this presentation • Mainly a graphics program, but is expanding the analytic capabilities • Free • Availiable from:
Network Analysis Programs • 5) SPAN - Sas Programs for Analyzing Networks (Moody, ongoing) • is a collection of IML and Macro programs that allow one to: • a) create network data structures from the Add Health nominations • b) import/export data to/from the other network programs • c) calculate measures of network pattern and composition • d) analyze network models • Allows one to work with multiple, large networks • Easy to move from creating measures to analysing data • All of the Add Health data are already in SAS • Availiable by sending an email to: • Moody.77@osu.edu
Network Data Collected in Add Health In -School Network Data • Complete Network Data collected in every school • Each student was asked to name up to 5 male and 5 female friends • These data provide the basic information needed to construct network context measures. • Due to response rates, we computed data on 129 of the 144 total schools. • Variable is named MF<#>AID form male friend, FF<#>AID for female friends.
Network Data Collected in Add Health In -School Network Data • Nomination Categories: • Matchable People Inside Ego’s School or Sister School • People who were present that day • ID starting with 9 and are in the sample • People who were absent that day • ID starting with 9, but not in the school sample • People in ego’s school, but not on the directory • Nomination appears as 99999999 • People in ego’s sister school, but not on the director • Nomination appears as 88888888 • People not in ego’s school or the sister school • Nomination appears as 77777777 • Other Special Codes • Nominations Appears as 99959995 • Nominator Categories • Matchable Nominator • Person who was on the roster, ID starts is 9. • Unmatchable Nominator • Person who was NOT on the roster, ID starts with 5 or 8
Network Data Collected in Add Health In -School Network Data
Network Data Collected in Add Health In -School Network Data Example 1. Ego is a matchable person in the School Out Un Out Out Un Un M Ego M Ego M M M M M M True Network Observed Network
Network Data Collected in Add Health In -School Network Data Example 2. Ego is not on the school roster M M M Un M Un M M M M M M Un Un Un True Network Observed Network
Network Data Collected in Add Health In -School Network Data
Network Data Collected in Add Health In -School Network Data
Network Data Collected in Add Health In -Home Network Data • Network Data were collected in both Wave1 and Wave 2 Surveys • There were two procedures: • Saturated Settings • Attempted to survey every student from the In-School sample. • 2 large schools, and 10 small schools. • Was supposed to replicate the in-school design exactly. • Unsaturated Settings • Each person was only asked to name one other person • In both cases, the design was not always carried out. As such, some of the students in the saturated settings were alowed to name only one male and one female friend, while some students who were in the non-saturated settings were asked to nominate a full slate of 5 and 5.
Network Data Collected in Add Health In -Home Network Data • Data Usage Notes: • Romantic Relation Overlap • For the W1 and W2 friendship data, any friendship that was also a romantic relation was recoded to 55555555, to protect the romantic relation nominations. • Bad Machine on Wave 2 Data • Data on from one school in wave 2 seems to be corrupted. We have no way to show this for certain, but it seems to be the case that data from machines 200065 or 200106 gave incorrect data. We suspect this is so, because almost everyone who used these two machines “nominated” the same person multiple times. This results in one person having an abnormally large in-degree. • All nomination #s are now valid • Unlike the in-school data, Ids starting with something other than ‘9’ can be nominated. • Same out-of-sample special codes • All other special codes for these data are the same as in the in-school data.
Network Data Collected in Add Health In -Home Network Data Descriptive Statistics for Saturated Settings
Constructing Network Measures Total Network To construct the social network from the nomination data, we need to integrate each person’s nominations with every other nomination. Methods: 1) Export the Nomination data to construct network in other program MOST of the other programs require you to pre-process the data a great deal before they can read them. As such, it is usually easier to create the files in SAS first, then bring them into UCINET or some such program. 2) Construct the network in SAS The best way to do this is to combine IML and the MACRO language. SAS IML lets you work with matricies in a (fairly) strait forward language, the SAS MACRO language makes it easy to work with all of the schools at once. Programs already set up to do this are availiabel in SPAN.
Constructing Network Measures Adjacency Matricies The key to analyzing / measuring the total network is constructing either an adjacency matrix or an adjacency list. These data structures allow you to directly identify both the people ego nominates and the people that nominate ego. Thus, the first step in any network analysis will be to construct the adjacency matrix. To do this you need to: 1) Identify the universe of possible people in the network. This is usually the same as the set of people that you have sampled. However, if you want to include ties to non-sampled people you may make the universe include all people named by anyone. 2) create a blank matrix with n rows and n columns. 3) loop over all respondents, placing a value in the column that corresponds to the persons they nominate. This can be binary (named or not) or valued (number of activities they do with alter).
Constructing Network Measures Total Network Data for 12th grade males in a small school.
Constructing Network Measures Total Network Program for creating a network and exporting it to PAJEK 0 prociml; 1 %include'c:\moody\sas\programs\modules\adj.mod'; 2 %include'c:\moody\sas\programs\modules\pajwrite.mod'; 3 %include'c:\moody\sas\programs\modules\pajpart.mod'; 4 use work.d; 5 read all var{aidr} into id; 6 read all var{mf1aid mf2aid mf3aid mf4aid mf5aid} into noms; 7 adjmat=adj(id,noms); /* adj(*) is a pre-programed module */ 8 adj_id=adjmat[,1]; 9 insamp=j(nrow(adj_id),1,0); /* identify people who are also in the sub-sample */ 10 do i=1to nrow(insamp); 11 iloc=loc(id=adj_id[i]); 12 if type(iloc)='N'thendo; 13 insamp[i]=1; 14 end; 15 free iloc; 16 end; 17 adjmat=adjmat[,2:ncol(adjmat)]; 18 file'c:\moody\conferences\add_health\ptp15_paj.net'; 19 call pajwrite(adjmat,adj_id,2); 20 file'c:\moody\conferences\add_health\ptp15_paj.clu'; 21 call pajpart(insamp); 22 quit;
Constructing Network Measures Resulting network as displayed by PAJEK. Total Network Senior Male subsample in Red
Constructing Network Measures Local Networks. • To create and calculate measures based only on the people ego nominates, you can work directly from the nomination list (don’t need to construct the adjacency matrix). • To create and calculate measures based on the received or reciprocated ties, you need to have a list of people who nominate ego, which is easiest to get given the adjacency matrix. • To calculate positional measures (density, reciprocity, etc.) all you need is the nomination data. • To calculate compositional data, you need both the nomination data and matching attribute data.
Constructing Network Measures Local Networks.
Constructing Network Measures An example network: All senior males from a small (n~350) public HS. Local Networks. Adjacency Matrix
Constructing Network Measures Local Networks. Example 2: Suppose you want to identify ego’s friends, calculate what proportion of ego’s female friends are older than ego, and how many male friends they have (this example came up in a model of fertility behavior). • You need to: • Construct a dataset with • (a) ego's id (aid*1 - make it a number instead of a character), • (b) age of each person, • (c) the friendship nominations variables. • Write a macro that loops over each community/School • For each community, do • a) Identify ego's friends • b) Identify their age • c) compare it to ego's age • d) count it if it is greater than ego's. • An example SAS program to do this is in the handouts.
Constructing Network Measures Peer Groups. Identifying cohesive peer groups requires first specifying what a cohesive peer group is. Potential defintions could be: a) all people within k steps of ego (extended ego-network) b) a set of people who interact with each other often (relative density) c) a set of people with a particular pattern of ties (a closed loop, for example) UCINET, STRUCTURE, NEGOPY and SPAN all provide methods for identifying cohesive groups. They all differ on the underlying definition of what constitutes a group. The FACTIONS algorithm in UCINET and NEGOPY’s algorithm use relative density. The CROWD algorithm is SPAN uses a combination of relative density and pattern. Once you have constructed the adjacency matrix, you can export to these other programs fairly easily. However, most of them are QUITE time consuming (FACTIONS, for example, is a bear) and take a good deal of time to run, so be sure you have identified exactly what you want before you start processing….
Constructing Network Measures Peer Groups Characteristics. Identifying Cohesive Sub-Groups • Cohesion: The group is difficult to separate; the connection of the group does not depend on one relation or person. • Groupness: Relative to the rest of the network, a cohesive sub - group has high relational volume. • Inclusion: Some people are not in groups while others bridge groups.
Examples of Peer groups within Add Health High Schools Crowds Algorithm
Observed Clustering within Adolescent Social Networks Network Characteristics of Sub Groups • On average, 65% of a school’s adolescents are in cohesive sub-groups. • 87% of all relations are within sub-groups. • The average sub-group has 22 members. • The average diameter for a sub-group is 3 steps. • The mean segregation index is .96 (1=Complete, 0=Random)
34% 65% 84% 86% 79% 74% Grade College Activities Race GPA Smoking Observed Clustering within Adolescent Social Networks Distribution of Characteristic within groups, relative to school distribution
Constructing Network Data School Level
Constructing Network Data School Level Inter-Group Relations
Same race friendship preference by racial heterogeneity 1.6 ) 1 Countryside h.s. 1.0 Same Race Friendship Preference (b .4 -.2 .1 .8 .3 .6 Racial Heterogeneity Analysis Using Network Data Nets as Dependent Variable: Racial Segregation
0.8 0.6 0.4 0.2 0 -0.2 -0.4 -0.6 GPA SES Fight College Drinking Same Sex Transitivity Same Race Both Smoke Same Clubs Intransitivity Same Grade Reciprocity Analysis Using Network Data Nets as Dependent Variable: Modeling the network Network Model Coefficients, In school Networks
Analysis Using Network Data Nets as Independant Variable: Suicide Relational Structures and Forms of Suicide Regulation Low High High Anomic Altruistic Integration Low Egotistic Fatalistic
Isolation Peer Anomie Alter School Ego Third ( ) Intransitivity Analysis Using Network Data Nets as Independant Variable: Suicide Measuring Isolation and Anomie.
Analysis Using Network Data Nets as Independant Variable: Suicide
By Race and Gender 30 Male 27.67 Female 20 19.45 Percent 15.71 13.92 10 11.13 10.29 8.51 8.08 3.52 3.23 0 White Mix / Other Black Hispanic Asian Analysis Using Network Data Nets as Independant Variable: Weapons 16.3% of American adolescent males and 5.14% of adolescent females report ever bringing weapons to school.
20 18.7 Member of a group 16.2 15 Bridges groups 14.13 Not a group member 10 7.43 5 4.93 4.53 0 Males Females Analysis Using Network Data Nets as Independant Variable: Weapons By position in the school friendship network
The Effect of Peer Group Composition on Sexual Debut* 0.40 0.35 0.30 0.25 0.20 Estimated Probability of Sexual Debut 0.15 0.10 0.05 N=380 N=1898 N=2026 N=660 N=88 0.00 0 % 1-25 % 26-50% 51-75% 76-100% Proportion of High-Risk Adolescents in Peer Group *Probability of experiencing sexual debut during the 18 months following the in-school survey. Controlling for age, socio-demographic characteristics, family and peer group characteristics (see table A1, model 6). Bearman and Bruckner, 199 Analysis Using Network Data Nets as Independant Variable: Sexual Debut
The Effect of Close Friends' Risk Status on Pregnancy Risk* 0.20 0.15 Estimated Probability of Pregnancy 0.10 0.05 N=308 N=932 N=100 N=517 N=550 N=427 0.00 no friends 0 % 1-25 % 26-50% 51-75% 76-100 % Proportion of Low-Risk Male and Female Close Friends *Probability of experiencing a pregnancy during the 18 months following the in-school survey. Controlling for age, socio-demographic and individual characteristics, family characteristics, and popularity (see table B1, model 3), Bearman and Brukner 1999. Analysis Using Network Data Nets as Independant Variable: Pregnancy