Download
1 / 13
130 likes | 283 Views
Climatic Impacts on West Antarctica. David H. Bromwich and Ryan L. Fogt Polar Meteorology Group, Byrd Polar Research Center The Ohio State University, Columbus, Ohio and Atmospheric Sciences Program, Department of Geography The Ohio State University, Columbus, Ohio.

E N D
Climatic Impacts on West Antarctica David H. Bromwich and Ryan L. Fogt Polar Meteorology Group, Byrd Polar Research Center The Ohio State University, Columbus, Ohio and Atmospheric Sciences Program, Department of Geography The Ohio State University, Columbus, Ohio
Impacts on the WAIS Climate • Current research suggests that two main processes affect the WAIS climate • The El-Niño Southern Oscillation (ENSO) • The Antarctic Oscillation (AA0), a.k.a. the Southern Annular Mode (SAM) • Perhaps the largest global climate change signals over the last 50 yr are found in the Antarctic Peninsula, a region affected by both ENSO and the AAO.
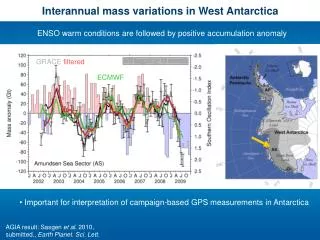
ENSO • The El-Niño Southern Oscillation (ENSO) strongly influences climate conditions in West Antarctica [Smith and Stammerjohn 1996; Turner 2004; Cullather et al. 1996] • The tropical ENSO signal is propagated to the South Pacific via a wave-train of alternating positive-negative geopotential height anomalies, termed the Pacific South American pattern (PSA). • Enhanced blocking occurs in the South Pacific during an El-Niño event, changing the circulation of the region [Renwick 1998] • The ENSO teleconnection to the South Pacific has shown considerable decadal variability, with the strongest relationship found in the 1990s [e.g., Fogt and Bromwich 2005] • Observations also depict the decadal variability • ENSO is typically monitored by the Southern Oscillation Index (SOI)
Previous Research on ENSO Decadal Variability in West Antarctica (75-90oS, 120-180oW) Modified from Bromwich et al. [2000]
-0.44 0.08 0.81 0.14 0.15 -0.15 -0.10 0.85 -0.19 0.06 0.26 -0.01 0.25 0.05 0.15 -0.23 -0.32 -0.90 0.46 -0.43 0.40 0.30 -0.85 0.43 0.44 -0.01 Annual Mean (May-April) correlation of ERA-40 MSLP and the Southern Oscillation Index (SOI / ENSO) 1980s From Fogt and Bromwich [2005]
Annual Mean (May-April) correlation of ERA-40 MSLP and the Southern Oscillation Index (SOI / ENSO) 1990s -0.38 -0.13 0.93 -0.60 -0.29 -0.45 -0.74 0.93 -0.50 -0.37 -0.21 -0.03 -0.08 0.07 -0.19 -0.11 -0.72 0.57 -0.79 0.15 -0.28 -0.76 -0.21 From Fogt and Bromwich [2005]
Upper Air Observations Showing Decadal ENSO Variability • With the correlation isolines interpreted on the spatial plots as isobars, changes in the circulation cause a more significant correlation in the zonal (west-east) wind / SOI over Southern South America and in the meridional (north-south) wind / SOI over the Antarctic Peninsula • These decadal variations in ENSO teleconnection to the South Pacific are evidenced in the upper air observations at Punta Arenas and Bellingshausen, respectively From Fogt and Bromwich [2005]
The Antarctic Oscillation (AAO) • The AAO (calculated from the standardized zonal (latitude-averaged) MSLP difference from 45o and 65o S) has been shown to have a trend towards its positive polarity [i.e., Thompson and Solomon 2002; Marshall 2003], implying a strengthening of the meridional (north-south) pressure gradient and the circumpolar zonal (west-east) winds. The trend is most pronounced during the 1990s (red regression line). -- 0.56 decade –1± 0.24 -- 1.69 decade –1± 1.09 Significant at 99.9% level
Antarctic Peninsula Warming • Annual mean surface temperatures have risen upwards of 5K along the Antarctic Peninsula in the last 50 years. • Both ENSO and the AAO have been shown to affect temperatures in the Antarctic Peninsula [i.e., van den Broekeet al. 2004; Turner 2004]. From Vaughan et al. [2001] ERA-40 2m temperature correlation with AAO, 1990s
Forcing of the Antarctic Oscillation • The forcing of the AAO is still a large debate: • greenhouse gases [e.g., Cai et al. 2003] • ozone [e.g., Thompson and Solomon 2002] • Tropical SSTs in the Pacific [e.g.,Fogt and Bromwich 2005] • Of these, the Tropical SSTs suggest that ENSO and the AAO are related. • In fact, Fogt and Bromwich [2005] show that the decadal variability of the ENSO teleconnection is governed by the coupling with the AAO.
Difficulties in grasping high southern latitude climate change: data problems • The NCEP-NCAR Reanalysis (NNR) has proven to have many shortcomings in Antarctica, including erroneous trends in the MSLP fields [e.g., Hines et al. 2000] • ERA-40 also has many shortcomings and is strongly guided by the assimilation of satellite data. • During the data sparse polar winter before the assimilation of satellite data, ERA-40 performs with uncharacteristically low skill [correlations with observed MSLP at the coastal stations average ~0.27 from 1958-1972; Bromwich and Fogt 2004] • Further, ERA-40 and NNR produce different analyses over the data sparse Southern Ocean.
ERA-40 and NNR Differences • For the 1958-1978 period, 500 hPa geopotential height differences in the South Pacific average ~50 gpm. • However, there are a few isolated events when the difference is greater than 200 gpm. • With limited observations to validate either reanalysis, it is difficult to determine which is more accurate.
Summary • There is strong decadal variability of the ENSO signal in the Bellingshausen Sea / Drake Passage region • The AAO has been progressing towards its positive polarity, especially in the 1990s, thus strengthening the meridional (north-south) pressure gradients. • The annual mean surface temperatures in the Antarctic Peninsula have risen upwards of 5K over the last 50 yr, one of the strongest warming rates seen globally. • Both the AAO and ENSO have been shown to influence the temperatures of the Antarctic Peninsula region. • The forcing of the AAO is still debatable; however, it is likely to be in part forced by the Tropical Pacific SSTs, and thus coupled with ENSO. • The relatively new ERA-40 reanalysis also has shown disparities with observations (as does NNR), thus making high southern latitude climate change studies difficult in perhaps the world’s largest meteorological data void.