Download
1 / 24
240 likes | 402 Views
Volcanic Effects in the Upper Atmosphere. Ani Chiti Cornell University & MIT Haystack Observatory Mentor: Shunrong Zhang August 8, 2013. Outline. Introduction Background Motivation Temperature Trend Models General model & cross terms Potential Effects of Volcanic Activity in Data

E N D
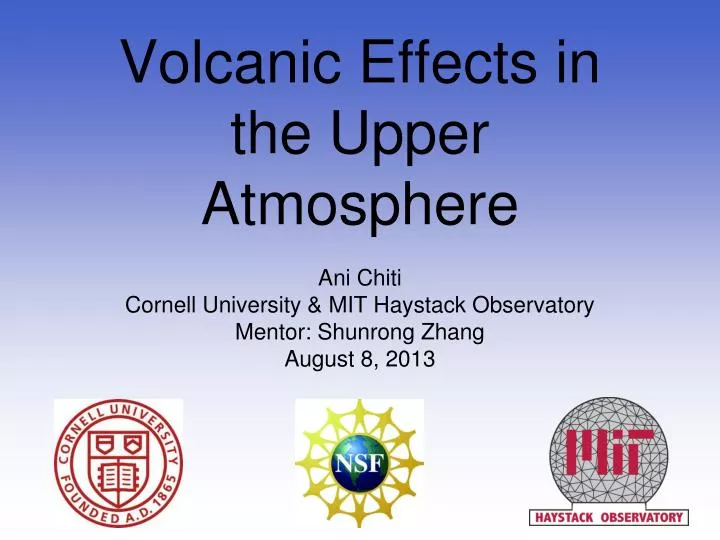
Volcanic Effects in the Upper Atmosphere • Ani Chiti • Cornell University & MIT Haystack Observatory • Mentor: Shunrong Zhang • August 8, 2013
Outline • Introduction • Background • Motivation • Temperature Trend Models • General model & cross terms • Potential Effects of Volcanic Activity in Data • Conclusions & Future Work
Volcanic Effects • Massive volcanic eruptions can have global effects on the climate • Release significant amounts of aerosols into atmosphere • Mount Tambora (1815), Krakatoa (1883), and Novarupta (1912) • Metrics of Effect • Dust Veil Index (DVI) vs. Volcanic Explosivity Index (VEI) • Highest DVI eruptions in the past 40 years were El Chichon (1982) and Pinatubo (1991)
El Chichon Date: March 28,1982 Location: Francisco Leon, Mexico (17N, 93W) DVI: 336 Potential Signals? Zhang et. al (2013)
Pinatubo Date: June 15, 1991 Location: Pampanga, Phillipines (15N, 120E) DVI: 500 Potential Signals? Zhang et. al (2013)
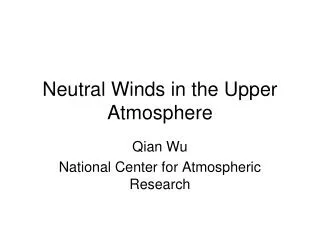
Data and Methods • Ion temperature data from 3 ISRs (Millstone Hill, Sondrestrom, St. Santin) • Millstone Hill (42N, 71W) • 1968 - Present • Sondrestrom (67N, 50W) • 1991 - Present • St. Santin (44N, 2E) • 1966 - 1987 • Neutral density from satellite drag data • Applied a modified long-term trend model to subtract out solar (F10.7) and geomagnetic (AP index) effects
Ti (K) F10.7 Temperature Trend Model • Data from years of high AP and F10.7 was excluded • Monthly medians were taken and fit to the trend equation
ISR Sites Daytime altitude profiles (SLT 12 ± 2.5) • Qualitative agreement between Sondrestrom and Millstone trends • Behavior agrees with expectations • Discrepancies with St. Santin may be given by: • Data gaps • Different trend values before the mid 1980s
400km - 450km -0.055 K/DVI 350km - 400km -0.097 K/DVI 300km - 350km -0.09 K/DVI Weighted DVI Ti residuals & DVI at Millstone 400km - 450km 350km - 400km 300km - 350km Weighted DVI Year
300km - 350km 250km - 300km Year Sources of uncertainties • Millstone Hill (right) has strong data coverage • Not necessarily true for Sondrestrom and St. Santin • Causes of scatter • Seasonal variations (shown) • Diurnal variations (not shown) • Data gaps
El Chichon Eruption -- Trend residuals Trend Line -- Trend residuals Trend Line -- Trend residuals Trend Line Altitude Profiles at Millstone
Conclusions • Small potential variations can be seen from volcanic activity • Potential effects from El Chichon can be seen in St. Santin and Millstone Hill • Potential effects from the Pinatubo eruption can be seen in Millstone Hill, but not as clearly in Sondrestrom • Satellite drag data had small dips corresponding to the eruptions, but geomagnetic activity overshadowed residuals • Future work needs to be done on refining model and testing the significance of these events • Bigger question is what are the theoretical effects of volcanic activity at these altitudes?
Acknowledgements • Shunrong Zhang and John Holt • KT Paul, Phil Erickson, Vincent Fish, and Heidi Johnson • Everyone at MIT Haystack • The other REU Students
References • Mauna Loa Observatory atmospheric transmission. Reduced solar radiation due to volcanic aerosols labeled. {{PD-USGov-DOC-NOAA}} Source: http://www.cmdl.noaa.gov/albums/cmdl_overview/Slide18.sized.png • Krueger, A., et al., El Chichon: The genesis of volcanic sulfur dioxide monitoring from space, J. Volcanol. Geotherm. Res. (2008), doi:10.1016/j.jvolgeores.2008.02.026 • Labitzke, K. and McCormick, M.P. (1992). Stratospheric temperature increases due to Pinatubo aerosols. Geophysical Research Letters 19: doi: 10.1029/91GL02940. issn: 0094-8276. • M. Bittner, D. Offermann, H.-H. Graef, M. Donner, K. Hamilton, An 18-year time series of OH rotational temperatures and middle atmosphere decadal variations, Journal of Atmospheric and Solar-Terrestrial Physics, Volume 64, Issues 8–11, 7 May 2002, Pages 1147-1166, ISSN 1364-6826, http://dx.doi.org/10.1016/S1364-6826(02)00065-2. • She, C.Y., Thiel, S.W. and Krueger, D.A. (1998). Observed episodic warming at 86 and 100 km between 1990 and 1997: Effects of Mount Pinatubo Eruption. Geophysical Research Letters 25: doi: 10.1029/98GL00178. issn: 0094-8276. • http://en.wikipedia.org/wiki/File:El_Chichón.jpg • http://en.wikipedia.org/wiki/File:Pinatubo91eruption_clark_air_base.jpg • Zhang, S.-R., and J. M. Holt (2013), Long-term ionospheric cooling: Dependency on local time, season, solar activity, and geomagnetic activity, J. Geophys. Res. Space Physics, 118, 3719–3730, doi:10.1002/jgra.50306.
Spline Fitting • Instead of binning by altitude and time, modes are integrated over a month to find a median • Then, a spline fit is applied to nodes on the altitude vs. Ti graph and a continuous plot is made • Since there is no binning of data, seasonal terms may be added
Median Binning Spline Fit average average daytime daytime nighttime nighttime Altitude (km) Altitude (km) Ti trend (K/year) Ti trend (K/year) Spline fit vs. Median Binning
INCONSISTENT! Bittner et. al (2002) She et. al (1998) Effects in the MLT Region
Krueger et. al (2008) Labitzke & McCormick (1992) Propagation of Aerosols
Satellite Drag Data 250km 365 day running average