Download
1 / 1
10 likes | 122 Views
New Mexico Rio Grande Water Operations Modeling: Creating a synthetic flow sequence representative of regional paleo-hydrology for alternatives analysis. Karen MacClune and Deborah Hathaway, S.S. Papadopulos & Associates, Boulder, CO. Introduction:

E N D
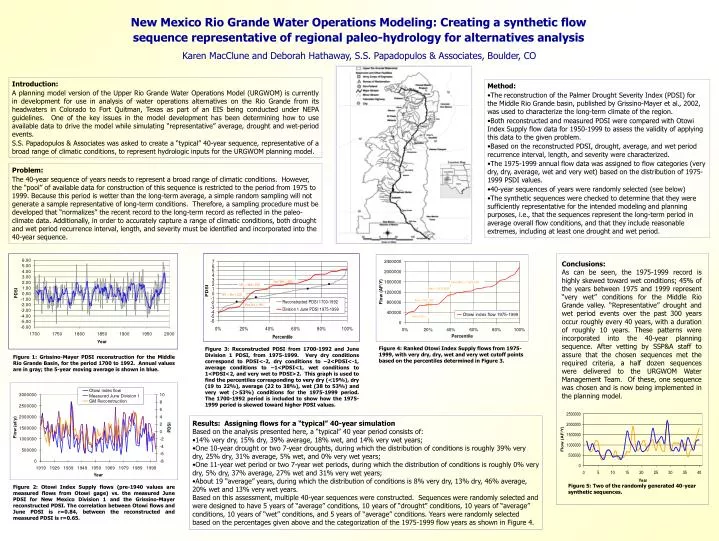
New Mexico Rio Grande Water Operations Modeling: Creating a synthetic flow sequence representative of regional paleo-hydrology for alternatives analysis Karen MacClune and Deborah Hathaway, S.S. Papadopulos & Associates, Boulder, CO Introduction: A planning model version of the Upper Rio Grande Water Operations Model (URGWOM) is currently in development for use in analysis of water operations alternatives on the Rio Grande from its headwaters in Colorado to Fort Quitman, Texas as part of an EIS being conducted under NEPA guidelines. One of the key issues in the model development has been determining how to use available data to drive the model while simulating “representative” average, drought and wet-period events. S.S. Papadopulos & Associates was asked to create a “typical” 40-year sequence, representative of a broad range of climatic conditions, to represent hydrologic inputs for the URGWOM planning model. • Method: • The reconstruction of the Palmer Drought Severity Index (PDSI) for the Middle Rio Grande basin, published by Grissino-Mayer et al., 2002, was used to characterize the long-term climate of the region. • Both reconstructed and measured PDSI were compared with Otowi Index Supply flow data for 1950-1999 to assess the validity of applying this data to the given problem. • Based on the reconstructed PDSI, drought, average, and wet period recurrence interval, length, and severity were characterized. • The 1975-1999 annual flow data was assigned to flow categories (very dry, dry, average, wet and very wet) based on the distribution of 1975-1999 PSDI values. • 40-year sequences of years were randomly selected (see below) • The synthetic sequences were checked to determine that they were sufficiently representative for the intended modeling and planning purposes, i.e., that the sequences represent the long-term period in average overall flow conditions, and that they include reasonable extremes, including at least one drought and wet period. Problem: The 40-year sequence of years needs to represent a broad range of climatic conditions. However, the “pool” of available data for construction of this sequence is restricted to the period from 1975 to 1999. Because this period is wetter than the long-term average, a simple random sampling will not generate a sample representative of long-term conditions. Therefore, a sampling procedure must be developed that “normalizes” the recent record to the long-term record as reflected in the paleo-climate data. Additionally, in order to accurately capture a range of climatic conditions, both drought and wet period recurrence interval, length, and severity must be identified and incorporated into the 40-year sequence. Conclusions: As can be seen, the 1975-1999 record is highly skewed toward wet conditions; 45% of the years between 1975 and 1999 represent “very wet” conditions for the Middle Rio Grande valley. “Representative” drought and wet period events over the past 300 years occur roughly every 40 years, with a duration of roughly 10 years. These patterns were incorporated into the 40-year planning sequence. After vetting by SSP&A staff to assure that the chosen sequences met the required criteria, a half dozen sequences were delivered to the URGWOM Water Management Team. Of these, one sequence was chosen and is now being implemented in the planning model. Figure 4: Ranked Otowi Index Supply flows from 1975-1999, with very dry, dry, wet and very wet cutoff points based on the percentiles determined in Figure 3. Figure 3: Reconstructed PDSI from 1700-1992 and June Division 1 PDSI, from 1975-1999. Very dry conditions correspond to PDSI<-2, dry conditions to –2<PDSI<-1, average conditions to –1<PDSI<1, wet conditions to 1<PDSI<2, and very wet to PDSI>2. This graph is used to find the percentiles corresponding to very dry (<19%), dry (19 to 22%), average (22 to 38%), wet (38 to 53%) and very wet (>53%) conditions for the 1975-1999 period. The 1700-1992 period is included to show how the 1975-1999 period is skewed toward higher PDSI values. Figure 1: Grissino-Mayer PDSI reconstruction for the Middle Rio Grande Basin, for the period 1700 to 1992. Annual values are in gray; the 5-year moving average is shown in blue. • Results: Assigning flows for a “typical” 40-year simulation • Based on the analysis presented here, a “typical” 40 year period consists of: • 14% very dry, 15% dry, 39% average, 18% wet, and 14% very wet years; • One 10-year drought or two 7-year droughts, during which the distribution of conditions is roughly 39% very dry, 25% dry, 31% average, 5% wet, and 0% very wet years; • One 11-year wet period or two 7-year wet periods, during which the distribution of conditions is roughly 0% very dry, 5% dry, 37% average, 27% wet and 31% very wet years; • About 19 “average” years, during which the distribution of conditions is 8% very dry, 13% dry, 46% average, 20% wet and 13% very wet years. • Based on this assessment, multiple 40-year sequences were constructed. Sequences were randomly selected and were designed to have 5 years of “average” conditions, 10 years of “drought” conditions, 10 years of “average” conditions, 10 years of “wet” conditions, and 5 years of “average” conditions. Years were randomly selected based on the percentages given above and the categorization of the 1975-1999 flow years as shown in Figure 4. Figure 5: Two of the randomly generated 40-year synthetic sequences. Figure 2: Otowi Index Supply flows (pre-1940 values are measured flows from Otowi gage) vs. the measured June PDSI for New Mexico Division 1 and the Grissino-Mayer reconstructed PDSI. The correlation between Otowi flows and June PDSI is r=0.84, between the reconstructed and measured PDSI is r=0.65.