Download
1 / 5
50 likes | 228 Views
Example – Utility function. In this example a decision maker has developed a patent.there is a possible purchaser for the patent. let’s assume that the price which purchaser is ready to pay is a given sum of C.

E N D
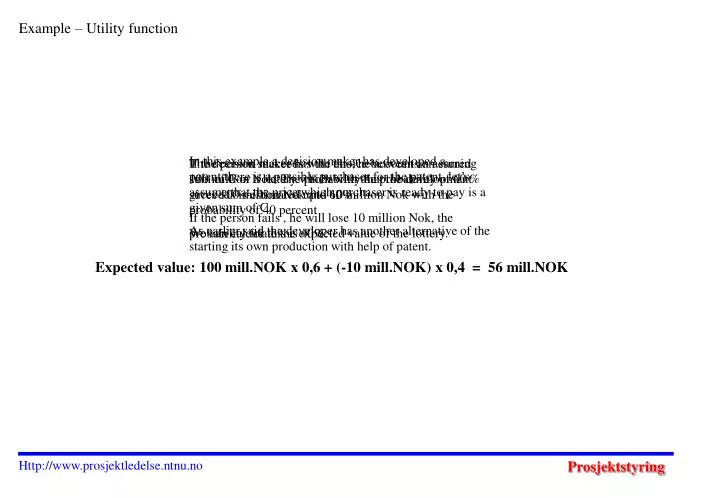
Example –Utility function In this example a decision maker has developed a patent.there is a possible purchaser for the patent. let’s assume that the price which purchaser is ready to pay is a given sum of C. As earlier said the developer has another alternative of the starting its own production with help of patent. If the person succeeds with this, he accounts on earning 100 million Nok. The probability that the development succeeds is estimated upto 60%. If the person fails , he will lose 10 million Nok, the probability for this is 40%. The decision maker has the choice between an assured sum of C or a lottery which with the probability of 60 % gives 100 million Nok and 10 million Nok with the probability of 40 percent We can calculate the expected value of the lottery. Expected value: 100 mill.NOK x 0,6 + (-10 mill.NOK) x 0,4 = 56 mill.NOK Http://www.prosjektledelse.ntnu.no
With which value of C, the decision maker will be hesitant between two alternatives: to sell the patent or produce by oneself? Http://www.prosjektledelse.ntnu.no
We assume that the decision-maker is risk-averse and C = 40 mill.NOK represents the sum that makes him hesitant to sell. At this sum, he may sell the patent or get the risk by himself. Risk-aversion means that the person prefers to choose the safer way, although he has possibility for larger rewards. We say that the utility of lottery for the decision-maker corresponds to 40 million NOK. This is the assured sum and since the person is risk averse, the assured sum is less than expected value of lottery. We can now illustrate the situation by a diagram. Http://www.prosjektledelse.ntnu.no
Utility u 1,0 0,9 A 0,8 B 0,7 C 0,6 a b 0,5 0,4 0,3 0,2 0,1 Result y -20 -10 0 10 20 30 40 50 60 70 80 90 100 Utility is a self-defined number. As shown in the figure along the vertical axis, we have chosen to use a scale from 0 to 1, but we could use a scale from 0 to100 or 32 to 78 or whatever we prefered for that. Utility is an abstract concept and does not have any phisycal or practical meaning. Cure A, represents a decision-maker who is risk-averse. The straight line B, between two outer points of -10 and 100 on result axis and respectively 0 and 1 on utility axis, applies to a decision-maker who is risik-indifferentThe assured sum at which person is ready to sell the patent is always equal to expected value of lotteri. We have earlier estimated the expected value upto 56 million Nok. If the developer succeeds with production, he can earn 100 million Nok. To this sum, we have given a utility equal to 1. Curve c, applies to a person who is risk-taker. If the developer fails with his production, he will lose 10 million Nok, The utility is equal to 0 here. Http://www.prosjektledelse.ntnu.no
Utility u 1,0 0,9 A 0,8 B 0,7 C 0,6 a b 0,5 0,4 0,3 0,2 0,1 Result y -20 -10 0 10 20 30 40 50 60 70 80 90 100 Normally, several points are needed to draw the utility function. But here just a smooth curve is drawn. For the same utility, we find the intersection point with Line A, risk aversion, and see that the assured sum for our decision-maker is y=40, 40 million NOK. This corresponds to when we use the sum of 40 million NOK, as assured sum for our decision maker. By going horizontally towards utility axis, we see that the matching utility value is 0,6. If we look at the figure, start from expected value of 56 million Nok , y=56, and go vertically upward , we will intersect the line B. We call this point with b. The assured sum of 40 million Nok corresponds to the lotteri value of 56 million Nok. For a risk-averse decision-maker, the assured sum is always less than expected value of lotteri. Http://www.prosjektledelse.ntnu.no