Download
1 / 26
260 likes | 422 Views
The advantages of speed control. Average overall costs of a compressed air station?. Energy costs. Investment costs. Maintenance costs. Basis: Power costs: 0.06 €/kWh, depreciation costs:: 5 years, interest: 5 %.

E N D
Average overall costs of a compressed air station? Energy costs Investment costs Maintenance costs Basis: Power costs: 0.06 €/kWh, depreciation costs:: 5 years, interest: 5% According to the results of an EU survey each year in the European Union some 80 TWh (80 x 1012 Wh) of power is consumed in compressed air plants. This is equivalent to over 10% of the industrial power requirements of the EU.
Why are the energy costs constitute such a high proportion? The most important reasons for this are: The costs of energy for: Expensive no-load times of compressors Expensive pressure balance times of compressors Compressed air lost during pressure balance processes Very broad pressure bandwidths of compressors Direct output losses during the production of compressed air (e.g. transmission losses owing to gears, V-belts) Leaks in the compressed air network Potential savings from using speed-controlled compressors • Important: A compressed air station should: • have as many load operating hours as possible • and, if possible, not a single no-load hour!
Capacity utilisation with conventional compressors Investigations show that the max. delivery quantity is only required during peak times and that on average most compressors only utilise 50 - 70% of their capacity Cumulative frequency 20% 40% 60% 80% 100% % capacity utilisation 4,000 operating hours p.a.; average full capacity utilisation 50-70%
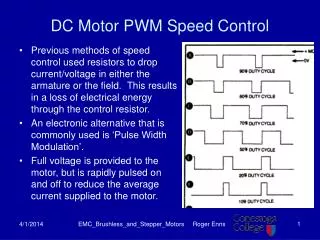
exact output adjustment 100 % Compressed air requirement 50 % 0 % Time 100 % Conventional Load / no-load regulation 50 % No-load times Coasting-down time Coasting-down time 0 % 100 % Speed control by means of SCD - technology 50 % Coasting-down time 0 % At 100% air requirement, conventional compressors and speed-controlled compressors work at full load. If the requirement drops, conventional compressors go into load-/no-load control. The drive motor performs switching cycles in which the pre-set coasting-down time has to be taken into account. The VARIABLE series varies its speed, hence reducing the delivery quantity exactly to match the requirements. • No expensive no-load times occur (approx. 25% of full output) • No switching cycles occur, i.e. less mechanical strain on the components
Example calculation of the potential energy savings from using an VARIABLE • Key data: • Compressor drive output: 60 kW • Capacity utilisation 70 full output share • 30% no-load time at approx. 25 - 30% full load consumption • Operating hours p.a. 4,000 • Required operating pressure: 10 bars • Energy costs: 6 cents /kWh
1. Avoidance of no-load times Example calculation: Average capacity utilisation (70%) 60 kW compressor 70% full load 30% no-load time at approx. 25 - 30% full load consumption 4,000 operating hours p.a. 4,000 operating hours p.a. x 30% no-load share x 25% of 60 kW x power costs (€/kWh) 1,200 operating hours x 15 kW x 6 (cents/kWh) 1,080 € saving p.a.
100 % (60 kW) 45 kW No-load consumption during pressure balance process Drive output [kW] 25 % (15 kW) No-load consumption after pressure balance process 15 kW approx. 1 min per pressure balance process Time [min] 2. Reduced unloading frequency Uneven networks result in frequent load / no-load changeovers: The compressor is relieved at each load / no-load changeover. The average relieve time is approx. 1 minute
2. Reduced unloading frequency Example calculation: Energy loss due to pressure balance times 60 kW compressor / pressure balance time approx. 1 min Receiver volume plant 80 L 15 load / no-load changeovers per hour 4.000 operating hours p.a. Energy costs 0.06 € p. kWh 100 % 100 % (60 kW) (60 kW) No-load consumption during pressure balance process 45 kW 45 kW bei Leerlaufleistungsaufnahme Antriebsleistung [kW] Entlastung Drive ouput [kW] 25 % 25 % (15 kW) (15 kW) Leerlaufleistungsaufnahme No-load consumption after pressure balance process 15 kW 15 kW nach Entlastung ca. 1 min pro Entlastung approx 1 min pro pressure balance process Zeit [min] Time [min] 4000 operating hours p.a. x 15 load / no-load changeovers p.h. 60,000 load/no-load changeovers p.a. x 1 min 60,000 min pressure balance time = 1,000 h pressure balance x 45 / 2 kW = 22,500 kWh x 6 cents 1,350 € saving p.a. Energy loss due to pressure balance times
3. Compressed air losses caused by unloading processes Example calculation: Compressed air loss caused by unloading processes: 60 kW compressor Receiver volume plant 80 L 15 load – no-load changeovers per hour 4,000 operating hours p.a. Pressure balance from 10 bars (OVP) to 1 bar (OVP) P1 x V1 = p2 x V2 p1 x V1 V2 = p2 11 bars (abs) x 80 L V2 = 2 bars (abs) V2 = 440 L (loss of compressed air per pressure balance process) 4,000 operating hours p.a. x 15 load / no-load changeovers per hour 60,000 changes p.a. x 440 L compressed air loss 26,400 m³ compressed air loss p.a. Comment: It costs an average of 2 cents to produce 1 m³ compressed air 26,400 m³ x 2 cents =528 € saving p.a.
Constant network pressure The VARIABLE compressors run at a constant operating pressure ( p 0.1 bars), Since high pressure = high energy enormous amounts of energy can be saved here. 1 bar higher pressure ( 6 – 8 % higher energy consumption) Conventional load / no-load regulation 11.2 Upper switching point 11.0 10.8 Potential saving 10.6 Pressure bandwidth (bars): 10.4 10.2 VARIABLE 10.0 Lower switching point 9.8 Example: Necessary operating pressure 10.0 bars
11,2 11,2 11,2 11,0 11,0 11,0 10,8 10,8 10,8 10,6 10,6 10,6 10,4 10,4 10,4 10,2 10,2 10,2 10,0 10,0 10,0 9,8 9,8 9,8 4. Constant network pressure • Example calculation: • Required operating pressure: 10 bars • Switch-on pressure for standard compressor: 10 bars • Switch-off pressure for standard compressor: 11 bars • Pressure band = 1 bar Operating hours p.a.: 4,000 Compressor consumption 60 kW Power costs: 0.06 €/kWh Conventional load / no-load regulation Herkömmliche Last - - Leerlaufregelung Herkömmliche Last Herkömmliche Last - - Leerlaufregelung oberer Schaltpunkt Upper switching point Druckband (bar) Einsparpotential Potential saving Pressure bandwidth (bar) VARIABLE VARIABLE VARIABLE VARIABLE unterer Schaltpunkt Lower switching point Beispiel: erforderlicher Betriebsdruck 10.0 bar Example: Necessary operating pressure 10.0 – bars Pressure band optimisation:generated operating pressure: 10.1 bars (pressure band = 0.1 bar 1 bar higher pressure 6 – 8 % higher energy consumption • 0.9 bars pressure band reduction • 0.9 x 7% of 60 kW x 4,000 h x 6 cent/kWh 907 € saving p.a.
Savings: direct drive over V-belt drive: • V-belt drive ( 96 – 97 %) • Direct drive ( 99.9 %) • 4,000 operating hours p.a., 60 kW motor • 2.4 kW saving x 4,000 operating hours • 9.600 kWh x 6 cents / kWh 576 € / saving p.a. 5. Direct drive • The compressor block drive is effected • directly by the drive motor via a maintenance-free coupling without any transmission loss • Optimal power transmission and constant efficiency throughout the entire service life • Up to 99.9% efficiency • Less noise emission than with V-belt or gear machines • Great operational reliability • Very easy to maintain and service • Compared to V-belt drives there is no additional maintenance
6. Leak reduction Compressed air lines always have leaks The amount of leakage depends, among other things, on the pressure in the pipelines. If pressure is reduced by 1 bar for example by means of speed control, these leaks are reduced by approx. 10%! Studies have shown that the average leakage rate of a compressed air station is approx. 20 - 30%.
6. Leak reduction Pressure band optimisation: generated operating pressure: 10.1 bars Example calculation: Basis: Required operating pressure: 10 bars Switch on pressure for standard compressor: 10 bars Switch-off pressure for standard compressor: 11 bars Operating hours p.a.: 4000 Compressor consumption 60 kW Volumetric flow rate approx. 8.5 m³/min Leak rate approx. 25% Power costs: 0.06 €/kWh • 0.9 bar pressure band reduction 1 bar pressure reduction = 10% leakage reduction • 2.125 m³/min leakage x 9% • 0.19 m³/min leak reduction 0.19 m³/min x 4,000 h 45,600 m³ / year x 2 cents/m³ • 25% leakage of 8.5 m³/min • 2,125 m³/min 912 € / saving p.a.
Total saving: an overview • Avoidance / reduction of: • No-load times: 1,080 € • Pressure balance times: 1,350 € • Pressure loss during pressure balance: 528 € • Pressure optimisation: 907 € • Direct drive: 576 € • Leak reduction 912 € Total saving p.a. approx.: 5,353 € by using a speed-controlled plant / VARIABLE! (Compared to: Standards at 70% capacity utilisation, 4,000 operating hours )
8 7 DIRECT STARTING 6 5 FULL-LOAD POWER CONSUMPTION BY MOTOR 4 GENTLE STARTING STAR - DELTA 3 2 Full-load rated current 1 VARIABLE - Very energy-conserving start-up behaviour 0 START-UP TIME [s] Other advantages • Advantage of VARIABLE: • Many customers pay according to current peak values • enormous saving of power costs • Relief for “weak” networks • Enormous relief for the mech. components (“changeover shocks” do not occur) • Start-up at 110% rated torque load
Other advantages 400 350 Changeover peak, star to Inrush load = U Power [A] delta = 2.7 -fold 4 -fold rated current rated current 300 250 200 Pulse-type starting: 60 kW plant with star-delta 150 starting Rated current 95 A, standard motor 60 kW 100 Continuous starting: 50 VARIABLE 60 - Very energy-conserving start-up behaviour 0 0 2 4 6 8 10 12 14 16 18 20 Time [s] By comparison Start-up current for of a 60 kW IEC motor 95 A x 2.7 ( 257 A + changeover peaks (approx. 4-fold) > 380 A Companies with medium voltage transformer station: transformer station must be designed for the high peak currents
1 1 0,95 0,95 0,95 0,95 0,95 0,95 0,945 0,945 0,935 0,935 0,93 0,93 0,93 0,93 0,92 0,92 0,9 0,9 0,9 0,9 0,8 0,8 h h 0,7 0,7 0,6 0,6 Wirkungsgrad 0,5 0,5 Speed range VARIABLE 90 Drehzahlbereich VARIABLE 100 Efficiency 0,4 0,4 5 5 – – 13 bar 13 bar 0,3 0,3 0,2 0,2 0,1 0,1 0 0 1000 1000 1500 1500 2000 2000 2500 2500 3000 3000 3500 3500 4000 4000 4500 4500 5000 5000 Drehzahl 1/min rpm 1/min SCD drive motor - Efficiency characteristics Owing to the special type of winding and the top grade sheet packets (high quality dynamo sheet), compared to IEC standard motors the ALUP SCD motor (motor protection class IP 55) is far more efficient over the entire load range Typical efficiency characteristics of an asynchronous motor 1 0,8 0,6 0,4 Efficiency 0,2 0 0 25 50 75 100 Capacity utilisation [%] Efficiency characteristics VARIABLE Motor Efficiency characteristics of a standard asynchronous motor • Advantage of VARIABLE: • Power cost saving owing to less power loss • Less self-heating of the motor or smaller size • Flat curve at a high level, especially compared to a < 100 % capacity utilisation
SCD frequency converter 1,0 cos phi = constant cos phi = 0.9 (load) 0.5 (no-load) VARIABLE cos phi 0,8 cos phi ( conventional technology asynchronous operation • Idle current: • Idle current (smaller than cos phi) must either • be paid for or • compensated. 0,6 No-load cos asynchronous operation 0,4 • Advantage of SCD technology • Power cost saving • Relief to network • Minor power factor correction 0,2 0,0 0 10 20 30 40 50 60 70 80 90 100 Capacity utilisation [%]
VARIABLE DIRECT VARIABLE Interaction of several compressors 14 12 Volumetric flow (m³/min) 10 8 6 4 2 0 10 20 30 40 50 60 70 80 90 100 110 120 130 140 150 160 Hours per week Using the „energy savering duo“ VARIABLE + DIRECT
AIR CONTROL 3 Base load control Master Slaves Slave Slave Slave Slave
Air Control 3 / BLCO Connection – networking BLCO (up to 9 compressors) • all compressors are managed via a RS 485 bus system RS 485 interface Air Control 3 MASTER Data cable 3-wire, 0.5 mm², shielded 1. 2. 3. 4. 8. .... Module DE 200 F Module DE 200 F Module DE 200 F RS 485 interface RS 485 interface Required signals: 1. Motor On / Off 2. Load operation / Idling 3. Fault message
The advantages of speed control • constant pressure • exact output adjustment • avoidance of idling times • reduced unloading frequency • extremely energy-saving drive behavior • no peak loads • very good (high) motor efficiency • constant cos • direct drive • excellent p spezific • Air Control 3 • flexible operating pressure 5 – 13 bar • reduction in leakage