Download
1 / 136
1.36k likes | 1.36k Views
This presentation examines the effects of the financial crisis and recession on the Texas P/C insurance markets. It discusses economic trends, key threats and issues facing insurers, regulatory reform, financial strength and ratings, and the impacts of the crisis on profitability, premium growth, underwriting performance, and catastrophe loss trends.

E N D
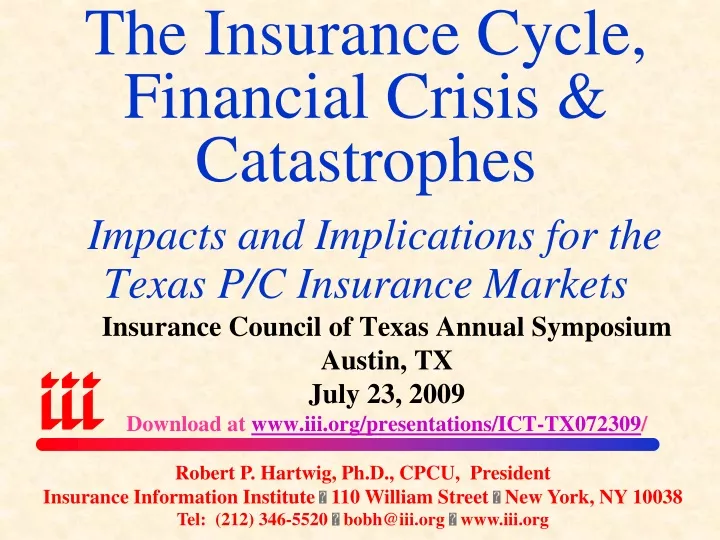
The Insurance Cycle, Financial Crisis & Catastrophes Impacts and Implications for the Texas P/C Insurance Markets Insurance Council of Texas Annual Symposium Austin, TX July 23, 2009 Download at www.iii.org/presentations/ICT-TX072309/ Robert P. Hartwig, Ph.D., CPCU, President Insurance Information Institute 110 William Street New York, NY 10038 Tel: (212) 346-5520 bobh@iii.org www.iii.org
Presentation Outline • The Economic Storm: Financial Crisis & Recession: US • Texas: Somewhat Less of an Economic Mess • Economic Trends: Personal, Commercial Exposure Implications • Key Threats and Issues Facing P/C Insurers Through 2015 • Regulatory Reform • Financial Strength & Ratings • Key Differences Between Insurer and Bank Performance During Crisis • P/C Insurance Industry Overview & Outlook: US & Texas • Profitability • Premium Growth • Underwriting Performance • Financial Market Impacts • Merger & Acquisition Activity • Capital & Capacity • Catastrophe Loss Trends: US & Texas
THE ECONOMIC STORMWhat the Financial Crisis and Recession Mean for the Industry’s Exposure Base and Growth
Real GDP Growth* The Q4:2008 decline was the steepest since the Q1:1982 drop of 6.4% Personal and commercial lines exposure base have been hit hard and will be slow to come back Recession began in December 2007. Economic toll of credit crunch, housing slump, labor marketcontraction has been severe but recovery is in sight *Blue bars are Estimates/Forecasts from Blue Chip Economic Indicators. Source: US Department of Commerce, Blue Economic Indicators 7/09; Insurance Information Institute.
Length of U.S. Business Cycles, 1929-Present* Duration (Months) Average Duration** Recession = 10.4 Months Expansion = 60.5 Months Length of expansions greatly exceeds contractions Month Recession Started * As of July 2009, inclusive; **Post-WW II period through end of most recent expansion. Sources: National Bureau of Economic Research; Insurance Information Institute.
Total Industrial Production,(2007:Q1 to 2010:Q4F) End of recession in late 2009, Obama stimulus program are expected to benefit industrial production and therefore insurance exposure both directly and indirectly Figures for 2010 revised upwards to reflect expected impact of Obama stimulus program and a gradual economic recovery Industrial production began to contracted sharply in late 2008 and plunged in Q1 2009 Sources: US Bureau of Labor Statistics; Blue Chip Economic Indicators (7/09); Insurance Info. Inst.
Real GDP Growth vs. Real P/C Premium Growth: Modest Association P/C insurance industry’s growth is influenced modestly by growth in the overall economy Sources: A.M. Best, US Bureau of Economic Analysis, Blue Chip Economic Indicators, 7/09; Insurance Information Inst.
Inflation Trends Pressures Claim Cost Severities via Medical and Tort Channels
Annual Inflation Rates(CPI-U, %), 1990-2010F Inflation peaked at 5.6% in August 2008 on high energy and commodity crisis. The recession and the collapse of the commodity bubble have produced temporary deflation. Sources: US Bureau of Labor Statistics; Blue Chip Economic Indicators, July 10, 2009 (forecasts).
Comparative 2008 Inflation Statistics Important to Insurers( %) CPI and “Core” CPI are not representative of many of the costs insurers face Medical/Legal costs typically run well ahead of inflation *Core CPI is the Consumer Price Index for all Urban Consumers (CPI-U) less food and energy costs. Source: US Bureau of Labor Statistics; Insurance Information Institute.
Top Concerns/Risks for Insurers if Inflation is Reignited CONCERNS:The Federal Reserve Has Flooded Financial System with Cash (Turned on the Printing Presses), the Federal Govt. Has Approved a $787B Stimulus and the Deficit is Expected to Mushroom to $1.8 Trillion. All Are Potentially Inflationary. What are the potential impacts for insurers? What can/should insurers do to protect themselves from the risks of inflation? KEY RISKS FROM SUSTAINED/ACCELERATING INFLATION Rising Claim Severities Cost of claims settlement rises across the board (property and liability) Rate Inadequacy Rates inadequate due to low trend assumptions arising from use of historical data Reserve Inadequacy Reserves may develop adversely and become inadequate (deficient) Burn Through on Retentions Retentions, deductibles burned through more quickly Reinsurance Penetration/Exhaustion Higher costsrisks burn through their retentions more quickly, tapping into re-insurance more quickly and potential exhausting their reinsurance more quickly Source: Ins. Info. Inst.
Labor Market TrendsFast & Furious: Massive Job Losses Sap the Economy Workers Comp & Other Commercial Exposure
Unemployment Rate:On the Rise January 2000 through June 2009 June 2009 unemployment jumped to 9.5%, and is now at it highest level since August 1983 Previous Peak: 6.3% in June 2003 Trough: 4.4% in March 2007 Unemployment will likely peak near 10 % during this cycle, impacting payroll sensitive p/c and l/h exposures Average unemployment rate 2000-07 was 5.0% Jun-09 Source: US Bureau of Labor Statistics; Insurance Information Institute.
U.S. Unemployment Rate,(2007:Q1 to 2010:Q4F)* Rising unemployment is eroding payrolls and workers comp’s exposure base. Unemployment is expected to peak above 10% in early 2010. * Blue bars are actual; Yellow bars are forecasts Sources: US Bureau of Labor Statistics; Blue Chip Economic Indicators (7/09); Insurance Info. Inst.
Monthly Change Employment*(Thousands) January 2008 through June 2009 Job losses since the recession began in Dec. 2007 total 7.2 mill; 14.7 million people are now defined as unemployed. Monthly losses in Dec. – May were the largest in the post-WW II period but pace of loss is diminishing Source: US Bureau of Labor Statistics: http://www.bls.gov/ces/home.htm; Insurance Info. Institute
The Texas EconomyLess of Mess in Texas & in Much Better Shape the US Overall, But Weakness is SpreadingLess Severe Impacts on P/C Insurer Exposure Growth
The Texas Economy Grew Faster than Most States in 2008 The TX economy grew by 2% in 2008 compared to 0.7% for the US
Fastest Growing States in 2008: TX is a Growth Leader Real State GDP Growth Percent The TX economy expanded by 2.0% in 2008 compared to 0.7% for the US: good for insurers in the state Texas was in a 4-way tie as the 8th-fastest growing state in 2008 Source: US Bureau of Economic Analysis; Insurance Information Institute.
Unemployment Rate: Texas is Doing Much Better Than US January 2000 through June 2009 US: 9.5% in June 2009 Texas: 7.5% in June 2009 TX had higher unemployment than the US from 2000 through 2006 ( 5.5% vs. 5.1%) but has been lower since 2007 ( 5.1% in TX vs. 5.9% for US) Jun-09 Source: US Bureau of Labor Statistics; Insurance Information Institute.
Unemployment Rates by State, June 2009: Highest 25 States* The unemployment rate has been rising across the country, but some states are doing much better than others. *Provisional figures for June 2009, seasonally adjusted. Sources: US Bureau of Labor Statistics; Insurance Information Institute.
Unemployment Rates By State, June 2009: Lowest 25 States* Texas had the 18th lowest unemployment rate in the US in June 2009 at 7.5% vs. 9.5% for the US *Provisional figures for June 2009, seasonally adjusted. Sources: US Bureau of Labor Statistics; Insurance Information Institute.
Unemployment in Texas is High for the Region, but Low vs. US Percent Unemployment in TX is the highest in the region, it still compares favorably to the US Source: US Bureau of Labor Statistics; Insurance Information Institute.
Unemployment in Largest Texas Cities but Below US in All Unemployment is up in all Texas metro areas, but less so than in the US overall Percent Source: US Bureau of Labor Statistics; Insurance Information Institute.
Hopeful Signs That the EconomyWill Begin to Recover Soon Recession Appears to be Bottoming Out, Freefall Has Ended Pace of GDP shrinkage is beginning to diminish Pace of job losses is slowing Major stock market indices well off record lows, anticipating recovery Some signs of retail sales stabilization are evident Financial Sector is Stabilizing Banks are reporting quarterly profits Many banks expanding lending to credit worthy people & businesses Housing Sector Likely to Find Bottom Soon Home are much more affordable (attracting buyers) Mortgage rates are still low relative to pre-crisis levels (attracting buyers) Freefall in housing starts and existing home sales is ending in many areas Inflation & Energy Prices Are Under Control Consumer & Business Debt Loads Are Shrinking Source: Ins. Info. Inst.
11 Industries for the Next 10 Years: Insurance Solutions Needed • Government • Education • Health Care • Energy (Traditional) • Alternative Energy • Agriculture • Natural Resources • Environmental • Technology • Light Manufacturing • Export Oriented Industries
Crisis-Driven Exposure ImplicationsHome, Contractor, Auto, Exposure Growth Slows as Sales Nosedive
New Private Housing Starts,1990-2010F (Millions of Units) New home starts plunged 34% from 2005-2007; Drop through 2009 is 73% (est.)—a net annual decline of 1.52 million units, lowest since record began in 1959 Exposure growth due to home construction forecast for HO insurers is dim for 2009 with some improvement in 2010. Impacts also for comml. insurers with construction risk exposure I.I.I. estimates that each incremental 100,000 decline in housing starts costs home insurers $87.5 million in new exposure (gross premium). The net exposure loss in 2009 vs. 2005 is estimated at about $1.3 billion. Source: US Department of Commerce; Blue Chip Economic Indicators (7/09); Insurance Information Inst.
Auto/Light Truck Sales,1999-2010F (Millions of Units) Weak economy, credit crunch are hurting auto sales; Gas prices have been a factor too. New auto/light truck sales are expected to experience a net drop of 6.7 million units annually by 2009 compared with 2005, a decline of 40.3% and the lowest level since the late 1960s Impacts of falling auto sales will have a less pronounced effect on auto insurance exposure growth than problems in the housing market will on home insurers Source: US Department of Commerce; Blue Chip Economic Indicators (7/09); Insurance Information Inst.
“Cash for Clunkers” or Car Allowance Rebate System (CARS)Program to Increase Fuel Efficiency and Stimulate Auto Sales Will Help Auto Insurers Too
Car Allowance Rebate System: How it Works • President Obama in June 2009 signed into law the Car Allowance Rebate System (CARS) also knows as “Cash for Clunkers” • Administered by the National Highway Traffic Safety Admin. (NHTSA), the program helps people purchase a new, more fuel efficient vehicle when trading in a less fuel efficient vehicle • Program allocates $1 billion toward purchases between July 1 and Nov. 1, 2009 or until funds are exhausted (final rule July 24) • Sense is that program will prove to be very popular and may be extended • People can get between $3,500 and $4,500 per vehicle, depending on fuel efficiency of new vehicle vs. old vehicle • Auto insurers should be able to generate between $75 - $125 million in net new auto premiums as people trade up and buy full coverage* *III estimate based on 250,000 cars purchased via CARS program generating $300-$500 additional premium per vehicle. Source: www.CARS.gov; NHSTA; Insurance Information Institute.
Car Allowance Rebate System: How it Works • Important Program Features • Car must be less than 25 years old • Only purchase or lease of new vehicles qualify • Trade-in must get 18mpg or less • Trade-in must have been registered and continuously insured for the past year • No voucher needed; dealer will apply credit at purchase • Trade-in must be scrapped; Get scrap value Source: www.CARS.gov; NHSTA; Insurance Information Institute.
Key Threats Facing Insurers Amid Financial CrisisChallenges for theNext 5-8 Years
Important Issues & Threats Facing Insurers: 2009 - 2015 • Erosion of Capital • Losses are larger and occurring more rapidly than is commonly understood or presumed • Surplus down 13%=$66B since 9/30/07 peak; 12% ($80B ) in 2008 • P/C policyholder surplus could be even more by year-end 2009 • Some insurers propped up results by reserve releases • Decline in PHS of 1999-2002 was 15% over 3 years and was entirely made up and them some in 2003. Current decline is ~13% in 5 qtrs. • During the opening years of the Great Depression (1929-1933) PHS fell 37%, Assets fell 28% and Net Written Premiums fell by 35%. It took until 1939-40 before these key measures returned to their 1929 peaks. • BOTTOM LINE: Capital and assets could fall much farther and faster than many believe. It will take years to return to the 2007 peaks (likely until 2011 with a sharp hard market and 2015 without one) Source: Insurance Information Inst.
Important Issues & Threats Facing Insurers: 2009 - 2015 • Reloading Capital After “Capital Event” • Continued asset price erosion coupled with major “capital event” could lead to shortage of capital among some companies • Possible Consequences: Insolvencies, forced mergers, calls for govt. aid, requests to relax capital requirements • P/C insurers have come to assume that large amounts of capital can be raised quickly and cheaply after major events (post-9/11, Katrina). • This assumption may be incorrect in the current environment • Cost of capital is much higher today, reflecting both scarcity & risk • Implications: P/C (re)insurers need to protect capital today and develop detailed contingency plans to raise fresh capital & generate internally. Already a reality for some life insurers. Source: Insurance Information Inst.
Important Issues & Threats Facing Insurers: 2009 - 2015 • Long-Term Reduction in Investment Earnings • Low interest rates, risk aversion toward equities and many categories of fixed income securities lock in a multi-year trajectory toward ever lower investment gains • Price bubble in Treasury securities keeps yields low • Many insurers have not adjusted to this new investment paradigm of a sustained period of low investment gains • Regulators will not readily accept it; Many will reject it • Implication 1: Industry must be prepared to operate in environment with investment earnings accounting for a smaller fraction of profits • Implication 2: Implies underwriting discipline of a magnitude not witnessed in this industry in more than 30 years. Yet to manifest itself. • Lessons from the period 1920-1975 need to be relearned Source: Insurance Information Inst.
Important Issues & Threats Facing Insurers: 2009 – 2??? • Regulatory Overreach • Principle danger is that P/C insurers get swept into vast federal regulatory overhaul and subjected to inappropriate, duplicative and costly regulation (Dual Regulation) • Danger is high as feds get their nose under the tent • Status Quo is viewed as unacceptable by all • Pushing for major change is not without significant risk in the current highly charged political environment • Insurance & systemic risk • Disunity within the insurance industry • Impact of regulatory changes will be felt for decades • Bottom Line: Regulatory outcome is uncertain and risk of adverse outcome is high Source: Insurance Information Inst.
Important Issues & Threats Facing Insurers: 2009 - 2015 • Creeping Restrictions on Underwriting • Attacks on underwriting criteria such as credit, education, occupation, territory increasing • Industry will lose some battles • View that use of numerous criteria are discriminatory and create an adverse impact on certain populations • Impact will be to degrade the accuracy of rating systems to increase subsidies • Predictive modeling also at risk • Current social and economic environment could accelerate these efforts • Danger that bans could be codified at federal level during regulatory overhaul • Bottom Line: Industry must be prepared to defend existing and new criteria indefinitely Source: Insurance Information Inst.
Important Issues & Threats Facing Insurers: 2009 -2015 • Emerging Tort Threat • No tort reform (or protection of recent reforms) is forthcoming from the current Congress or Administration • Erosion of recent reforms is a certainty (already happening) • Innumerable legislative initiatives will create opportunities to undermine existing reforms and develop new theories and channels of liability • Torts twice the overall rate of inflation • Influence personal and commercial lines, esp. auto liab. • Historically extremely costly to p/c insurance industry • Leads to reserve deficiency, rate pressure • Bottom Line: Tort “crisis” is on the horizon and will be recognized as such by 2012-2014 Source: Insurance Information Inst.
FINANCIAL STRENGTH & RATINGSIndustry Has Weathered the Storms Well
P/C Insurer Impairments,1969-2008 The number of impairments varies significantly over the p/c insurance cycle, with peaks occurring well into hard markets Source: A.M. Best; Insurance Information Institute
P/C Insurer Impairment Frequency vs. Combined Ratio, 1969-2008 Impairment rates are highly correlated with underwriting performance and reached record lows in 2007/08 2008 impairment rate was a record low 0.23%, second only to the 0.17% record low in 2007 and barely one-fourth the 0.82% average since 1969 Source: A.M. Best; Insurance Information Institute
Number of Impairments by State, 1969-2008 More TX insurers have become impaired over the past 40 years than in any other state TX, FL and CA have the largest number of impairments. Catastrophe risk plays a big role. Other factors influencing impairments include the political environment and business mix Source: A.M. Best; Insurance Information Institute
Frequency of Impairments by State, 1969-2008 (Impairments per 100 Insurers Domiciled in State) WY, LA, FL have the highest impairment rates in the country TX has the 9th highest impairment rate = 1.53% National average = 0.82% Source: A.M. Best; Insurance Information Institute
P/C Impairment Frequency vs. Catastrophe Points in Combined Ratio, 1977-2008 Impairment rates are highly correlated with underwriting performance and reached record lows in 2007/08 2008 impairment rate was a record low 0.23%, second only to the 0.17% record low in 2007 and barely one-fourth the 0.82% average since 1969 Source: A.M. Best, PCS; Insurance Information Institute
Summary of A.M. Best’s P/C Insurer Ratings Actions in 2008* P/C insurance is by design a resilient in business. The dual threat of financial disasters and catastrophic losses are anticipated in the industry’s risk management strategy. Despite financial market turmoil, high cat losses and a soft market in 2008, 81% of ratings actions by A.M. Best were affirmations; just 3.8% were downgrades and 4.0% upgrades *Through December 19. Source: A.M. Best. 46
Historical Ratings Distribution,US P/C Insurers, 2008 vs. 2005 and 2000 2000 2008 2005 A++/A+ and A/A- gains P/C insurer financial strength has improved since 2005 despite financial crisis Source: A.M. Best: Rating Downgrades Slowed but Outpaced Upgrades for Fourth Consecutive Year, Special Report,November 8, 2004 for 2000; 2006 and 2009 Review & Preview. *Ratings ‘B’ and lower.
Reasons for US P/C Insurer Impairments, 1969-2008 Deficient loss reserves and inadequate pricing are the leading cause of insurer impairments, underscoring the importance of discipline. Investment catastrophe losses play a much smaller role. Source: A.M. Best: 1969-2008 Impairment Review, Special Report,Apr. 6, 2008
Critical Differences Between P/C Insurers and BanksSuperior Risk Management Model & Low Leverage Makea Big Difference
How Insurance Industry Stability Has Benefitted Consumers BOTTOM LINE: Insurance Markets—Unlike Banking—Are Operating Normally The Basic Function of Insurance—the Orderly Transfer of Risk from Client to Insurer—Continues Uninterrupted This Means that Insurers Continue to: Pay claims (whereas 82 banks have gone under as of 7/17/09) The Promise is Being Fulfilled Renew existing policies (banks are reducing and eliminating lines of credit) Write new policies (banks are turning away people who want or need to borrow) Develop new products (banks are scaling back the products they offer) 50 Source: Insurance Information Institute