Download
1 / 30
300 likes | 432 Views
Vancouver’s Plan: Planning for the 2010 Olympics, and our future. Daniel Freeman Project Planning TransLink (SCBCTA). Olympics Transportation Plan BRT – Building Ridership Thriftily 98 B-Line / Canada Line (fall 2009) 97 B-Line / Evergreen Line (eta 2014) 99 B-Line / UBC

E N D
Vancouver’s Plan: Planning for the 2010 Olympics, and our future Daniel Freeman Project Planning TransLink (SCBCTA)
Olympics Transportation Plan • BRT – Building Ridership Thriftily • 98 B-Line / Canada Line (fall 2009) • 97 B-Line / Evergreen Line (eta 2014) • 99 B-Line / UBC • B-Line program expansion • Rapid Transit Planning • Funding the future Vancouver’s Plan
During the entire Olympic Games period Venues, sites and facilities Countries Host broadcast and Olympic Family Athletes and officials (50% in Whistler) Technical officials Accredited media Workforce Vehicles Transportation by Numbers – Magnitude of Games 65+ 85 2,900+ 6,100 300+ 10,000 55,000 4,500+ Daily Totals 60,000 to 135,000 10,000 to 58,000 60,000+ Spectators (Vancouver events) Spectators (Whistler events) Participants at Celebration sites
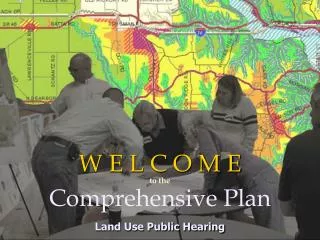
Details subject to change Host City Olympic Transportation Plan
85% Existing Capacity 85% at Games time
Solution: Increase Supply • Permanent Service Improvements • Canada Line • Third SeaBus (50% increase in service) • 48 additional SkyTrain cars (30% increase capacity) • 2007 to 2009 bus expansion (200 added to fleet) • Golden Ears Bridge • Increased hours and frequency on major transit routes, including SkyTrain and SeaBus • Additional 180 on-demand buses operating throughout region (Surge management service plan) • Additional 30 HandyDART • Shuttles from venues to key SkyTrain stations • West Coast Express (80% increase)
Solution: Shift Demand • University breaks will relieve demand • Access to public transit included in Olympic ticket purchase • TDM Strategy • Travel Smart & Know Before You Go Target 30% reduction in demand
2. BRT in VancouverBuilding Ridership Thriftily • 98 B-Line / Canada Line (fall 2009) • 97 B-Line / Evergreen Line (eta 2014) • 99 B-Line / UBC • B-Line program expansion
Canada Line – A Vital Transportation Link Waterfront Tunnel Vancouver City Centre Yaletown - Roundhouse Elevated Olympic Village At-grade Broadway - City Hall Station King Edward Oakridge - 41st Ave. Langara - 49th Ave. Marine Drive Templeton Bridgeport Aberdeen Sea Island Centre YVR - Airport Lansdowne Richmond - Brighouse
144th KGH 140th 152th 148th SURREY CENTRAL STATION KING GEORGE STATION 96th Avenue 88th Avenue 76th Avenue 72nd Avenue (NEWTON EXCHANGE) 64th Avenue Highway 10 South Surrey Park & Ride 32nd Ave Diversion KGH /152nd Street 24th Avenue 17th SB / 18th NB WHITE ROCK CENTRE (SEMI MALL)
B-Line Program Expansion ‘399’ B-Line King George Hwy / 104th Ave
B-Line Program Expansion ‘399’ B-Line King George Hwy / 104th Ave
Need For Studies • Period of rapid expansion in system extent and ridership • Network planned in previous studies nearing build-out • Increasing system complexity, multiple modes • Need to • design for Customers • ensure efficient system • support local plans • Many interdependencies • Network-shaping decisions are imminent 3. Rapid Transit Planning
4. Funding the Future: Financial Challenge $450 million new 9 8 7 Bus Service Millions Hrs $150 million new 6 5 4 No new money 3 2 1 0 2002 2004 2006 2008 2010 2012 2014 2016 2018
Existing TransLink Revenue Sources: Replacement Tax Parking Sales Tax Real Estate Revenue Hydro Levy Transit Revenue Fuel Tax Property Tax Ways to Fund Transportation Examples of Revenue Sources Used Elsewhere: Vehicle Fees Annual Vehicle Registration Fee Driver License Fees Road User Fees Congestion Pricing Facility tolls Distance based Cordon tolls HOT Lanes Distance Based Insurance Revenue from Land Use Development Charges Benefiting Area Tax Parking Site Tax Land Value Taxation Tax Increment Financing Property Transfer Tax Consumption Taxes Hotel Tax (tax on accommodation sales) Local Sales Tax Utility Fees Cell Phone Levy Landfill Tax System Revenues Sponsorship New Advertising Opportunities Carbon Offsets Other Sources Tax Free Bonds Business License Fee Commuter Tax Payroll Tax Income Tax Shipping Container Charges
Existing TransLink Revenue Sources: Replacement Tax Parking Sales Tax Real Estate Revenue Hydro Levy Transit Revenue Fuel Tax Property Tax Funding sources under consideration Possible New Revenue Sources: • System Revenues • Sponsorship • New Advertising Opportunities • Carbon Offsets • Shipping Container Charges Annual Vehicle Registration Fee Road User Fees Property Transfer Tax
Thank You Daniel Freeman Project Planning TransLink (SCBCTA) dan.freeman@translink.ca 604-423-3059