Download
1 / 32
320 likes | 454 Views
Evaluating Changes in Landscape-scale Organic C Due to Tillage. Dennis E. Rolston Land, Air and Water Resources University of California, Davis. Faculty Dennis Rolston Johan Six Chris VanKessel Jan Hopmans Richard Plant Kyaw Tha Paw U Ted Hsiao. PGRs, SRAs, GSRs Amy King Jeannie Evatt

E N D
Evaluating Changes in Landscape-scale Organic C Due to Tillage Dennis E. RolstonLand, Air and Water Resources University of California, Davis
Faculty Dennis Rolston Johan Six Chris VanKessel Jan Hopmans Richard Plant Kyaw Tha Paw U Ted Hsiao PGRs, SRAs, GSRs Amy King Jeannie Evatt Dianne Louie Guy Shaver Alan Idris Juhwan Lee Tony Matista Jim MacIntyre Several undergrads Research Team
Grower Cooperators • Tony Turkovitch and Martin Medina of Button and Turkovitch, Winters, CA Funding Sources • Kearney Foundation of Soil Science • CA Dept of Food and Agriculture • CA Energy Commission
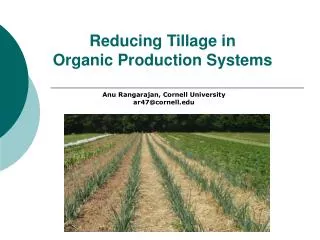
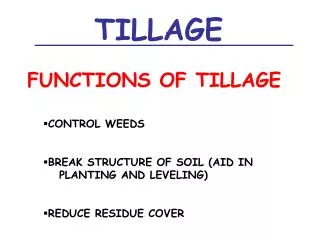
Soil Carbon and Tillage • Studies in the Midwest indicate that considerable C can be sequestered by conservation tillage practices • How about in California? • Need to occasionally reform beds and furrows • Higher mean annual soil temperature
Conservation tillage practices have increased by 300% in the Midwest during the last decade. In California however, less than 0.3% of crop acreage is farmed using conservation tillage practices (courtesy of Jeff Mitchell). (Conservation tillage Information Center, Lafayette, IN, 2002)
Minimum tillage could have large impacts on water and air quality TMDL issues PM10 issues
“The San Joaquin Valley is currently classified as a serious non-attainment region for PM10 under both state and federal standards. “ Dec. 30, 2004 San Joaquin Valley Air Pollution Control District
Objectives • Quantify C input pathways and their spatial and temporal variations at field scale • Determine effects of tillage on the spatial distribution of short-term rates of C cycling and greenhouse gas emissions • Improve existing models to predict long-term soil C sequestration and greenhouse gas emissions at field scale following implementation of minimum tillage
Micrometeorological tower and gas flux chambers Transect North 64 m Standard tillage 9.1 m 400 m Minimum tillage 64 m 770 m Figure 1. Field diagram showing the 140 soil sampling locations. The micromet towers, automated chambers, and below ground sampling locations are located near the west transect in the middle of each field. Total field area = 30.8 ha
Intensive Soil Sampling with a Geoprobe • 140 sites sampled 8/03, prior to tillage operations • Sampled to 1 m depth with a Geoprobe • Soil samples from 5 depths (0-15, 15-30, 30-50, 50-75, and 75-100 cm) • Analyzed for physical/chemical properties as well as C and N content • Intensive sampling again in ‘06
Turkovich Farm, August 2003 Distribution of soil C and N at the 0-15 cm depth
Hand harvesting for grain & biomass June 2003 Residue measurements Wheat crop prior to tillage
Residue control Sept.-Oct. 2003 Decreased wheat and corn biomass by 40 and 65%, respectively.
Minimum till and standard till fields Corn planted the following April (2004)
Measurements • Soil sampling for physical, chemical, and biological variables including soil C and N • Environmental variables such as rain + irrigation, ET, air temp, humidity, net radiation • C inputs from crops and weeds, residue incorporation • CO2 exchange with vegetation and soil • Greenhouse and trace gas emissions from soil – CO2, N2O, CH4, NO
Eddy covariance measurement system One tower in each field Spatial measurement scale=several ha -Wind velocity in 3D -CO2 concentration and flux -Air & surface soil temperature -Soil heat flux -Net radiation -Relative humidity
Automated chamber -Chamber closed for 1 min, open for 30 min -Fans to mix gas in chamber -CO2 concentration measured by IRGA -Spatial measurement scale=0.62 m2 -Temporal patterns
Small chambers for CO2 and N2O fluxes • CO2 concentration in chambers measured by IRGA • N2O concentration sampled with syringes and analyzed by GC • Gas fluxes calculated from increase in concentration with time • Many small chambers employed to determine spatial patterns IRGA Small, insulated chambers Spatial measurement scale = 0.012 m2
PVC chambers (0.05 m2)with portable lids are sampled routinely for both CO2 and N2O
Comparisons of flux measurements -Mean CO2 flux in micromoles CO2 m-2 s-1 for three measurement systems on November 21, 2003. Standard deviations are in parentheses. -Fluxes before tillage were about 1.0 for both micromet & automated chambers -Comparisons at other times are in fairly good agreement also
Below ground measurements -Temperature -Water content -Water potential -Air pressure -CO2 concentration -N2O concentration Probes in furrow
Mean monthly CO2 exchange from eddy-covariance measurements. Positive values are emissions from the soil. Negative values are CO2 uptake by vegetation. See Paw U et al. poster Corn growth
Plant and hand-harvest yield characteristics due to tillage treatment
CO2 flux & soil temperature are measured 24 hrs/day in automated gas chambers in both treatments.
planting harvest 1st major rain • Temporal flux related to trends in soil temp. and water content. Large spatial variability (see posters of Lee et al. & Shaver et al.). • Late Oct flux occurred 1 day after first rain • Little or no difference in flux due to tillage treatment • Flux during winter from furrows in MT >ST due to large amount of crop residue in furrows
1st flood irrigation Large flux from side-dressed areas • Emissions of N2O (& NO) occurred only after fertilizer applications • Largest emissions occurred directly over the fertilizer injection band • Minor differences in flux due to tillage treatment
C and N cycle modeling • Models as tools to “scale up” from the plot/field to landscape and regional scale • We plan to use two “landscape-scale” models • DNDC • DayCent • Models tested by comparing simulations to our field data • Tested models then used to simulate C sequestration and greenhouse gas emissions at landscape and regional scales and connect to economic models
Initial model testing with field data See poster by Adam Wolf et al.
Conclusions so far • Eddy-covariance approach allows detection of C inputs and outputs not possible with chambers or soil sampling • CO2 fluxes from chambers compare well with fluxes of respiration from eddy covariance • Could not detect increased CO2 emission following incorporation of wheat residue • Measurable N2O and NO emissions occur only after fertilizer application, and only small differences due to tillage • Initial simulations with DNDC may indicate some underestimation of CO2 emission but reasonable estimates for N2O
Ongoing research • Continue all measurements described above • Use spatial statistical tools to visualize and correlate landscape-scale patterns of soil C and N and physical and chemical properties with greenhouse gas emissions and C sequestration • Compare DNDC and DayCent simulations with field data and couple these models to an economic model