Download
1 / 6
60 likes | 183 Views
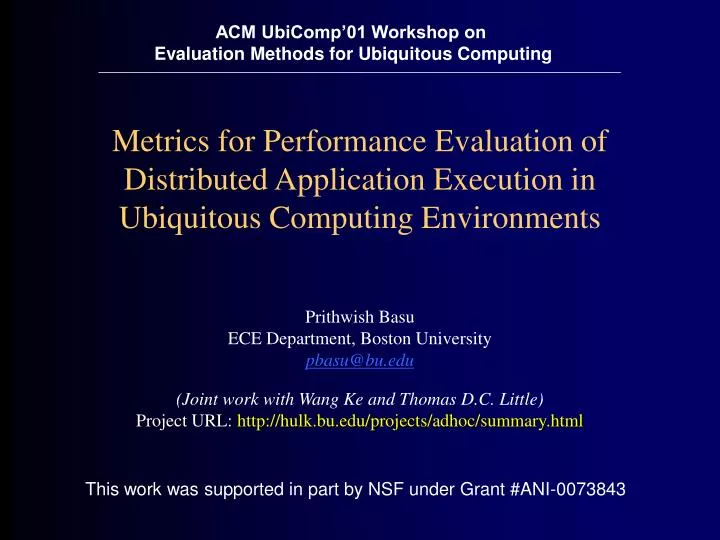
ACM UbiComp’01 Workshop on Evaluation Methods for Ubiquitous Computing. Metrics for Performance Evaluation of Distributed Application Execution in Ubiquitous Computing Environments. Prithwish Basu ECE Department, Boston University pbasu@bu.edu

E N D
ACM UbiComp’01 Workshop on Evaluation Methods for Ubiquitous Computing Metrics for Performance Evaluation of Distributed Application Execution inUbiquitous Computing Environments Prithwish Basu ECE Department, Boston University pbasu@bu.edu (Joint work with Wang Ke and Thomas D.C. Little) Project URL: http://hulk.bu.edu/projects/adhoc/summary.html This work was supported in part by NSF under Grant #ANI-0073843
Overview of our Project • We are investigating techniques for modeling distributed UbiComp applications • Logical representation of applications in terms of component sub-tasks as resource dependency graphs or task graphs • Physical resources are selected on-the-fly just before actual execution of task • Focus: Distributed protocols that are adaptive to network partitions due to user/device mobility
data-flow edge proximity edge A Smart Presentation Application The user does not care which particular devices perform the presentation Overhead Display summary presentation data Smart Storage/CPU (possibly mobile) Wireless PDA (mobile user) auxiliary devices to control presentation (can be moved) Mouse Local Screen Keyboard
(Paths in G) Task Graphs and Embedding nodes (colors indicate distinct device categories) d2 a1 b2 Embedding 1 Aa1 Bb2 Cc2 a2 d1 b1 U u A c1 c2 tree edges d2 a1 b2 B C Embedding 2 Aa2 Bb1 Cc1 a2 non-tree edge d1 b1 Task Graph u c1 c2
Variable System Parameters • Topology related: • #Devices in network ~ richness of network connectivity etc. • Fraction of devices that rely on wireless AP / ad hoc routing • Mobility patterns: random highly predictable • Task Graph related: • #nodes in a task/resource graph • Complexity of relationships between nodes of a task graph • #Instances of resources in a network with similar capabilities • Traffic related • Average data rates of applications • Background traffic patterns: low load heavy load • #Instances of simultaneously running tasks