Download
1 / 33
340 likes | 498 Views
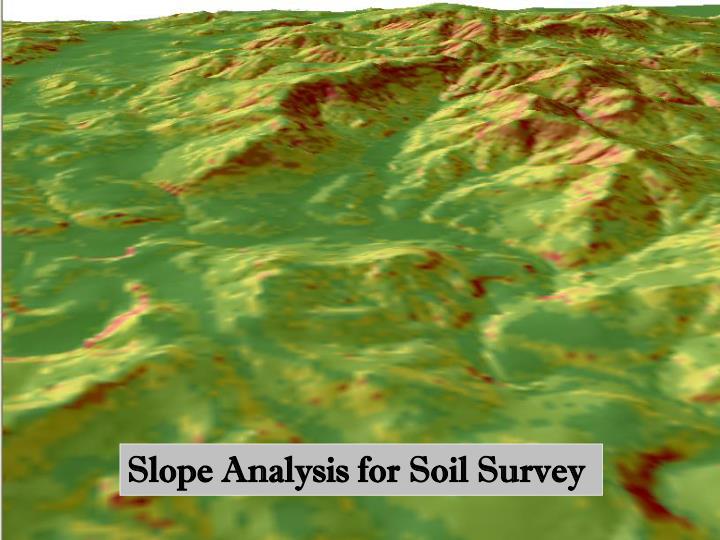
Slope Analysis for Soil Survey. Importance of High-Quality Slope Data Used for: Primary Reference Layer for Soil Delineation Soil Data Viewer Interpretations Hydrologic Modeling – Hanford Nuclear Cleanup Identification of Landslides (LIDAR enhances) WinPst Interpretations

E N D
Importance of High-Quality Slope Data • Used for: • Primary Reference Layer for Soil Delineation • Soil Data Viewer Interpretations • Hydrologic Modeling – Hanford Nuclear Cleanup • Identification of Landslides (LIDAR enhances) • WinPst Interpretations • Landform Mapping in Okanogan • USFS Soil Disturbance Ratings • Military Interpretations • National Commodity Crop Production Index • TEUI Toolkit • Primary Input for Predictive Modeling
Factors Affecting Slope Analysis • Source DEM – Techniques used to create DEM • Remote Sensed \ Interpolated vs. Field Sampled • Point sampling method, density, location • Algorithm used to create surface from points • Horizontal Resolution – Cell size • Vertical Resolution – Precision of Elevation • Slope calculation method
Also… • Topography – variation, complexity • Size of study area • Complexity of soils – polygon density
Typical Approaches for Soil Survey: • Use available USGS DEM (either 10m or 30m) • Run ESRI slope calculation • Use Zonal Statistics or… • NRCS Slope Model to intersect slope classes with soils data
Brief Review: • Zonal Statistics and NRCS Slope Model • Procedures • Advantages \ Limitations • Alternative approaches – advantages \ limitations
Slope Grid with Soils ESRI default classification: Jenks Natural Breaks
Benefits: • Fast, easy procedure • Handles survey-wide data • Output is standard dbf table (select \ edit \ join) • Limitations: • Provides Mean and STD only (range) • Results per MUSYM – not per polygon
National Slope Model (with all Generalizing Removed)
The User Enters the Input DEM and the Reclassification Values
The Output of the Model is a Polygon shapefile with Slope Classification Attributes. Next, Intersect the slope and soil Shapefiles…
Each polygon retains both Slope and Musym attributes. Though symbolized here by Slope, each soil delineation can also be seen.
The next step is to calculate Acres and Export the dbf table…
Open the dbf table in Excel and Create a Pivot Table Summarize the Acreage for each Slope per MUSYM MUSYMMUNAME 169 Willamette silt loam 0 – 3% 170 Willamette silt loam 3 – 12% 171 Willamette silt loam 12 – 20%
Benefits: • Handles survey-wide data • Provides Acres per Slope Class per Map Unit • Limitations: • Multi-step Process • Must run multiple iterations for different classes • Does not show distribution of data within Range • Result per MUSYM – not per Polygon
Objectives: • Identify Distribution of Slope within Range (per MUSYM) • 2) Retain Spatial link to Individual Polygons
MUSYMMUNAME 169 Willamette silt loam 0 – 3% 170 Willamette silt loam 3 – 12% 171 Willamette silt loam 12 – 20%
Reclassify Slope Grid by Single Percent Intervals (Integers) • Add 0.5 to “raw” slope grid • Convert to Integer • Use Conditional statement to create Upper or Lower Limit • e.g. Con(Ingrid > 29, 30, Ingrid) to facilitate processing The resulting slope grid in the example contains integer values: {1,2,3,…30}
Next, Intersect Slope with Soils as before, then calculate acres… Open dbf table in Excel and create Pivot Table for summarization
MUSYMMUNAME 169 Willamette silt loam 0 – 3% 170 Willamette silt loam 3 – 12% 171 Willamette silt loam 12 – 20% 2 – 8% ???
MUSYMMUNAME 169 Willamette silt loam 0 – 3% 170 Willamette silt loam 3 – 12% 171 Willamette silt loam 12 – 20% 9 – 17 % ???
Objective 2: Retain Spatial link to Individual Polygons • Create New Field as Long Integer • Calculate New Field: Acres X 100,000 • (to obtain unique ID for polys)
Run Zonal Statistics Use the Multiplied Integer Acre Field for the ‘Zone’ Use the Unclassified ‘raw’ Slope Grid
Join the Zonal Statistics Output table to the Soil (soil.acint – zonal.value) Select desired MUSYM (switch to view Selected Features) Sort by Mean: This is the Mean Slope for individual Polys ! Note Acreage for Outliers ! Zoom to Selection for Verification
Benefits: • Determine the Slope Distribution on the landscape rather than applying a preconceived slope classification to the analysis • Provides descriptive statistics per polygon with capability to query and locate features in the spatial data • Limitations: • In EARLY stages of development • may yet encounter significant problems \ limitations • AREA limitations unknown (processing) • Many steps required