Download
1 / 17
180 likes | 359 Views
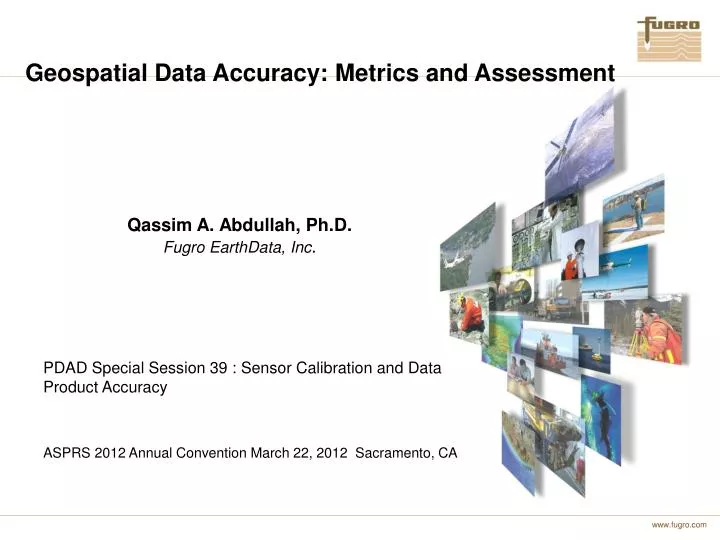
Geospatial Data Accuracy: Metrics and Assessment. Qassim A. Abdullah, Ph.D. Fugro EarthData, Inc. PDAD Special Session 39 : Sensor Calibration and Data Product Accuracy ASPRS 2012 Annual Convention March 22, 2012 Sacramento, CA. Sensors Technologies Today.

E N D
Geospatial Data Accuracy: Metrics and Assessment Qassim A. Abdullah, Ph.D. Fugro EarthData, Inc. PDAD Special Session 39 : Sensor Calibration and Data Product Accuracy ASPRS 2012 Annual Convention March 22, 2012 Sacramento, CA
Sensors Technologies Today 1) Silicon Electronics made it possible to build: • Large Format Aerial Mapping Camera • Medium Format Aerial Mapping Camera • Small Format Multi-purpose Camera • Special Application Mapping Sensors • Panoramic and Oblique Camera • Thermal Sensors • Multi-Spectral/Hyper-spectral Sensors • Space-based imaging Sensors 2) LiDAR 3) IFSAR Image courtesy, Microsoft
Today’s Geospatial Data Acquisition: Very Complex World Panoramic Push Broom Oblique Framing LiDAR
Complex mapping processes … • Complex technologies result in complex processes • How Complex are today’s technologies? • A laser system generate millions of pulses per second flown at speed of 200 – 300 knots • A space-based imaging Radar provide DEM of Earth Terrain with vertical accuracy of 1 meter or better • How about a full waveform digitization laser that record object surface every 2 nano second? • Human skills and knowledge may sometimes be lacking the proper understanding of such complex technologies • Proper training is essential to solve such complex puzzle • Not understanding the complex technologies leads to errors in the acquired data
Types of Errors In Geospatial Data FACT: Errors can be minimized but can never be eliminated… • Gross errors or “blunders” They can be of any size or nature, and tend to occur through carelessness. • Random Errors: are the small differences between repeated measurements of the same quantity • often of the order of the finest division in the measuring scale or device • It can be caused by operator skill level • Random errors have very definite statistical behavior and so can be dealt with by statistical methods • It can be minimized but not eliminated • Systematic Errors: are those which we can be modeled mathematically and therefore corrected Examples: GPS problems, camera calibration, earth curvature, atmospheric effects, inaccurate lever arm determination, etc.
Bias versus Random Errors Random error Systematic error Date
Actions Required to Minimize the Occurrence of Errors • Project planning stage: • Follow manufacturers recommendation on operating the sensor • Stay within the limits of the operation parameters of the auxiliary systems such as GPS and IMU • Data Processing stage: • Sensor orientation determination: • Do not compromise aerial triangulation or the boresight processes • Plan extra check points within the project area • Make sure you have the correct calibration for the system • Datum Confirmation: • Make sure that you are using the right vertical and horizontal datum • Avoid using older datums as they may not be that accurate (i.e. NAD27, NAD83/86, WGS84(transit), etc.)
Bias in Map Coordinates Example of bias caused by confusing NAD83(86) and HARN in Indiana SPC
Biased observations An RMSE of 0.52 ft will cause a rejection to ortho delivery mapped at 1”=50’ scale Allowed RMSE according to ASPRS standard = ±0.50’ Results after Bias removal
What every user want beside pretty pictures? Thermal Imagery GSD = 50 cm Altitude 2,300 ft
User is interested in: • Accurate Data • Discriminator: • Check points fit • High definition/ high resolution • Clean Data • Discriminator: • Matching mosaic lines (Both imagery and LiDAR) • Noise free Data (for LiDAR) • Decent radiometric quality (if optical imagery) • Manageable Data • Discriminator • Common file format • Optimized data size (i.e. lossless compression)
How Accuracy Standard should look like? The LiDAR case a) Classification According to LiDAR Point Accuracy: 1. Engineering class-I grade LiDAR data accuracy, for products with: Horizontal accuracy of RMSEX = RMSEY = 20 cm or better Vertical accuracy of RMSEv = 5 cm or better 2. Engineering class-II grade LiDAR data accuracy, for products with: Horizontal accuracy of RMSEX = RMSEY = 30 cm or better Vertical accuracy of RMSEv = 10 cm or better 3. Planning class-I grade LiDAR data accuracy, for products with: Horizontal accuracy of RMSEX = RMSEY = 0.60 m or better Vertical accuracy of RMSEv = 20 cm or better 4. Planning class-II grade LiDAR data accuracy, for products with: Horizontal accuracy of RMSEX = RMSEY = 0.75 m or better Vertical accuracy of RMSEv = 30 cm or better 5. General purpose grade LiDAR data accuracy, for products with: Horizontal accuracy of RMSEX = RMSEY = 1.2 m or better Vertical accuracy of RMSEv = 0.50 m or better 6. User defined Accuracy, for productsthat do not fit into any of the previous five categories. The above accuracy figures should only be guaranteed in open flat and rolling terrains.
How Accuracy Standard should look like? The LiDAR case b) Classification According to LiDAR Surface Definitions (quality): 1. Engineering class-I grade LiDAR data quality, for a LiDAR surface with: a) Nominal post spacing of 0.30 m or less 2. Engineering class-II grade LiDAR data quality, for a LiDAR surface with: a) Nominal post spacing of 0.70 m or less b) To have optional break lines 3. Planning class-I grade LiDAR data quality, for a LiDAR surface with: a) Nominal post spacing of 1.0 m or less b) To have optional break lines 4. Planning class-II grade LiDAR data quality, for a LiDAR surface with: a) Nominal post spacing of 1.5 m or less b) To have optional break lines 5. General purpose grade LiDAR data quality, for a LiDAR surface with: a) Nominal post spacing of 2.0 m or less b) To have optional break lines 6. User defined quality, for products that do not fit into any of the previous five
How Accuracy Standard should look like? The Imagery case Class I quality: To serve applications that requires very fine details or high resolution. The standard can specify the ground resolution for this class of maps to be one of the following subclasses: IA: GSD= 2.5cm (1.0in.) IB: GSD= 5.0cm (2.0in.) IC: GSD= 7.5cm (3.0in.) Class II quality: To serve applications that requires good details or high resolution. The standard can specify the ground resolution for this class of maps to be one of the following subclasses: IIA: GSD= 10cm (4in) IIB: GSD= 12.5cm (5.0in.) IIC: GSD= 15cm (6in.). Class III quality: To serve applications that requires acceptable details or medium resolution. The standard can specify the ground resolution for this class of maps to be one of the following subclasses: IIIA: GSD= 20cm (8in.) IIIB: GSD= 25cm (10.0in.) IIIC: GSD= 30cm (12in.)
How Accuracy Standard should look like? The Imagery case While geometrical quality classes for imagery-based map could look like this regardless of the resolution of the products: Class-I Accuracy: To serve applications that require a high horizontal and vertical accuracy as specified in the following subclasses: IA: RMSEx = RMSEy = RMSEv = 3.8 cm (1.5in.) IB: RMSEx = RMSEy = RMSEv = 7.6cm (3in.) IC: RMSEx = RMSEy = RMSEv = 11.4cm (4.5in.) Class-II Accuracy: To serve applications that require a medium range of horizontal and vertical accuracy as specified in the following subclasses: IIA: RMSEx = RMSEy = RMSEv = 15 cm (6in.) IIB: RMSEx = RMSEy = RMSEv = 19cm (7.5in.) IIC: RMSEx = RMSEy = RMSEv = 22.8cm (9in.) Class-III Accuracy: To serve applications that require a horizontal and vertical accuracy range as specified in the following subclasses: IIIA: RMSEx = RMSEy = RMSEv = 23 cm (9in.) IIIB: RMSEx = RMSEy = RMSEv = 38cm (15in.) IIIC: RMSEx = RMSEy = RMSEv = 46cm (18in.) Class-IV Accuracy: To serve all other products with resolution not included in the three quality classes. Such products should meet horizontal and vertical accuracy according to the following formula: RMSEx = RMSEy = RMSEv = 1.5 Ground Sampling Distance of the final product
Other Quality Indicators Beside 20 Check Points • Horizontal shift in seam lines in ortho photo: • How much should be acceptable? • Smear in ortho photo • How much should be acceptable? • Wavy roads in ortho photo: • How much should be acceptable? • Vertical shift between flight lines in LiDAR data • How much should be acceptable? • Noise and unfiltered data in LiDAR data: • How much should be acceptable?
Thank You qabdullah@fugro.com mappingmatters@asprs.org