Download
1 / 1
10 likes | 164 Views
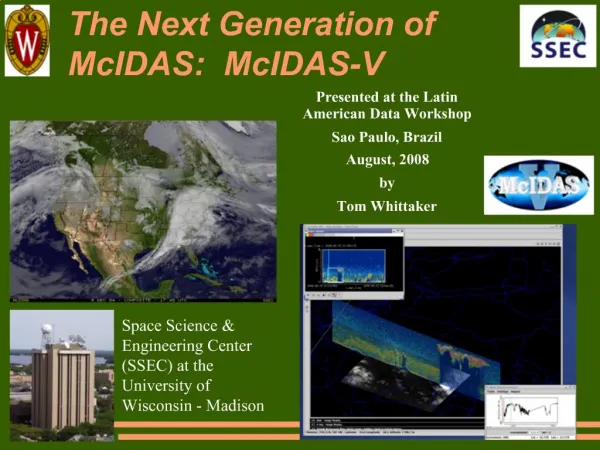
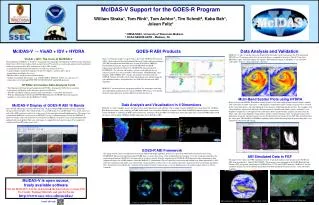
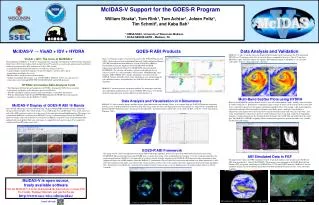
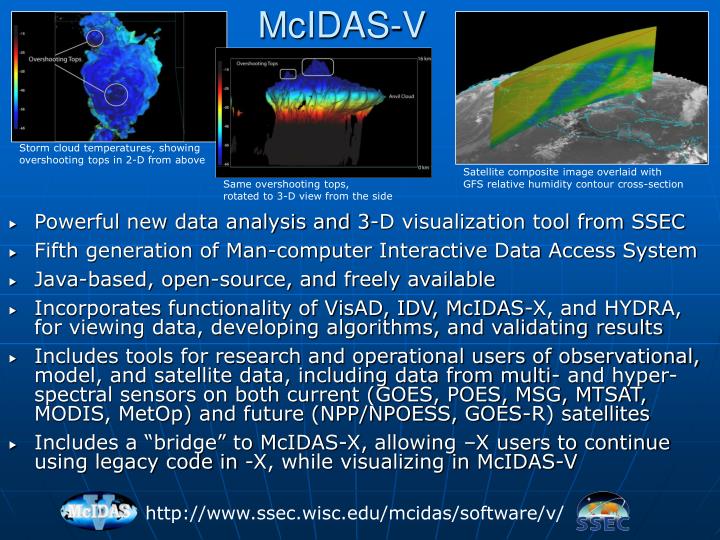
McIDAS-V. Storm cloud temperatures, showing overshooting tops in 2-D from above. Satellite composite image overlaid with GFS relative humidity contour cross-section. Same overshooting tops, rotated to 3-D view from the side. Powerful new data analysis and 3-D visualization tool from SSEC

E N D
McIDAS-V Storm cloud temperatures, showing overshooting tops in 2-D from above Satellite composite image overlaid with GFS relative humidity contour cross-section Same overshooting tops, rotated to 3-D view from the side • Powerful new data analysis and 3-D visualization tool from SSEC • Fifth generation of Man-computer Interactive Data Access System • Java-based, open-source, and freely available • Incorporates functionality of VisAD, IDV, McIDAS-X, and HYDRA, for viewing data, developing algorithms, and validating results • Includes tools for research and operational users of observational, model, and satellite data, including data from multi- and hyper-spectral sensors on both current (GOES, POES, MSG, MTSAT, MODIS, MetOp) and future (NPP/NPOESS, GOES-R) satellites • Includes a “bridge” to McIDAS-X, allowing –X users to continue using legacy code in -X, while visualizing in McIDAS-V http://www.ssec.wisc.edu/mcidas/software/v/