Download
1 / 1
10 likes | 148 Views
McIDAS-V Support for the GOES-R Program William Straka 1 , Tom Rink 1 , Tom Achtor 1 , Joleen Feltz 1 , Tim Schmit 2 , and Kaba Bah 1 1 CIMSS/SSEC, University of Wisconsin-Madison 2 NOAA/NESDIS/ASPB – Madison, WI.

E N D
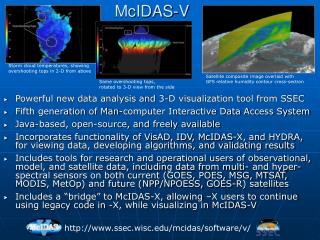
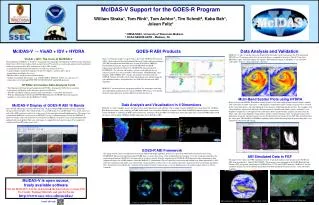
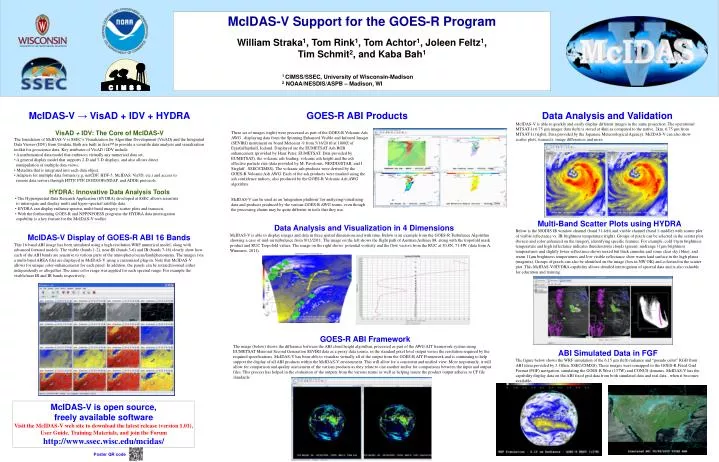
McIDAS-VSupport for the GOES-R Program William Straka1, Tom Rink1, Tom Achtor1, Joleen Feltz1, Tim Schmit2, and Kaba Bah1 1 CIMSS/SSEC, University of Wisconsin-Madison 2 NOAA/NESDIS/ASPB – Madison, WI McIDAS-V → VisAD + IDV + HYDRA VisAD + IDV: The Core of McIDAS-V The foundation of McIDAS-V is SSEC’s Visualization for Algorithm Development (VisAD) and the Integrated Data Viewer (IDV) from Unidata. Both are built in Java™ to provide a versatile data analysis and visualization toolkit for geoscience data. Key attributes of VisAD / IDV include: • A mathematical data model that embraces virtually any numerical data set, • A general display model that supports 2-D and 3-D displays, and also allows direct manipulation of multiple data views, • Metadata that is integrated into each data object, • Adapters for multiple data formats (e.g. netCDF, HDF-5, McIDAS, Vis5D, etc.) and access to remote data servers through HTTP, FTP, DODS/OPeNDAP, and ADDE protocols. HYDRA: Innovative Data Analysis Tools • The Hyperspectral Data Research Application (HYDRA) developed at SSEC allows scientists to interrogate and display multi and hyper-spectral satellite data. • HYDRA can display radiance spectra, multi-band imagery, scatter plots and transects. • With the forthcoming GOES-R and NPP/NPOESS programs the HYDRA data interrogation capability is a key feature for the McIDAS-V toolkit. GOES-R ABI Products Data Analysis and Validation McIDAS-V is able to quickly and easily display different images in the same projection. The operational MTSAT-1r 6.75 mm imager data (left) is stored at 4km as compared to the native, 2km, 6.75 mm from MTSAT-1r (right). Data provided by the Japanese Meteorological Agency). McIDAS-V can also show scatter plots, transects, image differences and more. These set of images (right) were processed as part of the GOES-R Volcanic Ash AWG , displaying data from the Spinning Enhanced Visible and Infrared Imager (SEVIRI) instrument on board Meteosat -9 from 5/16/2010 at 1000Z of Eyjafjallajökull, Iceland. Displayed are the EUMETSAT Ash RGB enhancement (provided by Hans Peter, EUMETSAT. Data provided by EUMETSAT), the volcanic ash loading, volcanic ash height and the ash effective particle size (data provided by M. Pavolonis, NESDIS/STAR, and J. Sieglaff , SSEC/CIMSS). The volcanic ash products were derived by the GOES-R Volcanic Ash AWG. Each of the ash products were masked using the ash confidence indices, also produced by the GOES-R Volcanic Ash AWG algorithm. McIDAS-V can be used as an 'integration platform’ for analyzing/visualizing data and products produced by the various GOES-R AWG teams, even though the processing chains may be quite different in tools that they use. Multi-Band Scatter Plots using HYDRA Below is the MODIS IR window channel (band 31-left) and visible channel (band 1-middle) with scatter plot of visible reflectance vs. IR brightness temperature (right). Groups of pixels can be selected in the scatter plot (boxes) and color enhanced on the imagery, identifying specific features. For example, cold 11μm brightness temperature and high reflectance indicates thunderstorm clouds (green); midrange 11μm brightness temperatures and slightly lower reflectance shows mixed but thick cumulus and some clear sky (blue), and warm 11μm brightness temperatures and low visible reflectance show warm land surface in the high plains (magenta). Groups of pixels can also be identified on the image (box in NW OK) and colorized in the scatter plot. This McIDAS-V/HYDRA capability allows detailed interrogation of spectral data and is also valuable for education and training. Data Analysis and Visualization in 4 Dimensions McIDAS-V is able to display images and data in three spatial dimensions and with time. Below is an example from the GOES-R Turbulence Algorithm showing a case of mid-air turbulence from 9/12/2011. The image on the left shows the flight path of Austrian Airlines 88, along with the tropofold mask product and RUC Tropofold values. The image on the right shows potential vorticity and the flow vectors from the RUC at 30.8N, 71.4W. (data from A. Wimmers, 2011). McIDAS-V Display of GOES-R ABI 16 Bands This 16-band ABI image has been simulated using a high-resolution WRF numerical model, along with advanced forward models. The visible (bands 1-2), near-IR (bands 3-6) and IR (bands 7-16) clearly show how each of the ABI bands are sensitive to various parts of the atmosphere/ocean/land/phenomena. The images (via a multi-band AREA file) are displayed in McIDAS-V using a customized plug-in. Note that McIDAS-V allows for unique color-enhancements for each panel. In addition, the panels can be rotated/zoomed either independently or altogether. The same color range was applied for each spectral range. For example the visible/near IR and IR bands respectively.. GOES-R ABI Framework The image (below) shows the difference between the ABI cloud height algorithm, processed as part of the AWG AIT framework system using EUMETSAT Meteosat Second Generation SEVIRI data as a proxy data source, in the standard pixel level output verses the resolution required by the required specifications. McIDAS-V has been able to visualize virtually all of the output from the GOES-R AIT Framework and is continuing to help support the display of all ABI products within the McIDAS-V environment. This will allow for a consistent and unified view. More importantly, it will allow for comparison and quality assessment of the various products as they relate to one another and/or for comparisons between the input and output files. This process has helped in the evaluation of the outputs from the various teams as well as helping insure the product output adheres to CF file standards. ABI Simulated Data in FGF The figure below shows the WRF simulation of the 6.15 mm (left) radiance and “pseudo color” RGB from ABI (data provided by J. Otkin, SSEC/CIMSS). These images were remapped to the GOES-R Fixed Grid Format (FGF) navigation, simulating the GOES-R West (137W) and CONUS domains. McIDAS-V has the capability display data on the ABI fixed grid data from both simulated data and real data , when it becomes available. McIDAS-V is open source, freely available software Visit the McIDAS-V web site to download the latest release (version 1.01), User Guide, Training Materials, and join the Forum http://www.ssec.wisc.edu/mcidas/ Poster QR code