Download
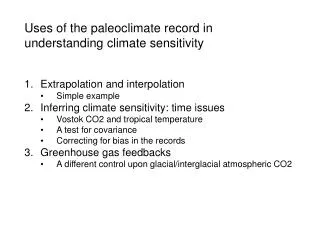
1 / 23
230 likes | 344 Views
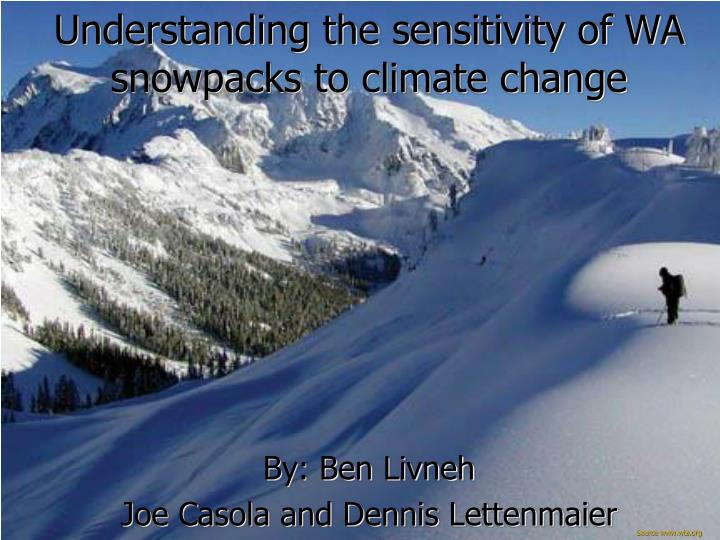
Understanding the sensitivity of WA snowpacks to climate change. By: Ben Livneh Joe Casola and Dennis Lettenmaier. Source www.wta.org. Overview. Motivation and scope What has been done so far… Current work Implications on future snowpack / future work…. Motivation.

E N D
Understanding the sensitivity of WA snowpacks to climate change By: Ben Livneh Joe Casola and Dennis Lettenmaier Source www.wta.org
Overview • Motivation and scope • What has been done so far… • Current work • Implications on future snowpack / future work…
Motivation % Change from 1961-1990 Base • Snowpacks have been projected to decline as temperature warms; • Snow acts as a natural reservoir/buffer, to redistribute winter precipitation later into spring and summer when it is needed, important for water-supply, wildlife, etc… • Quantifying storage is critical for water managers, allocating man-made reservoir capacity if needed… Source www.usgcrp.com Man-made Reservoir Seasonal Reservoir *Uncertainties exist in future temperatures / snowpacks; Question: How sensitive are WA snowpacks to temperature change? ≈ Source www.waterencyclopedia.com Source www.wunderground.com
Scope & Methods • Estimate snowpack sensitivity to temperature change: 1. 3 methods employed by *Casola et al (~2008): -Geometric approach -Regression analysis -SNOTEL observations 2. Present work using coupled and offline large-scale atmospheric models (GCM) and land models (LSM). *Casola J., L. Cuo, B. Livneh, D.P. Lettenmaier, M. Stoelinga , P. Mote, and J.M. Wallace. “Assessing the Impacts of Global Warming on Snowpack in the Washington Cascades”. Journal of Climate; in press
Sensitivity Analysis Q: How much snow water equivalent (SWE) reduction will be caused by 1° C warming? • SWE affected by both changes in temp. and precip. Focus on temp. changes: Domain SWE = (T) λ = sensitivity
Geometric Approach =23% mean Apr 1 SWE lost for +1°C warming Simply shifting the snow-line upwards in response to warming causes loss in SWE… Elevation (m) Snow storage Volume (S(z) x A(z)) Variation of SWE with height Hypsometric distribution of land area with height
Regression Approach • Using April 1 SWE measurements at 24 snow courses in the Cascades for 1970-2006, The basin-integrated SWE is regressed upon winter temperature
SNOTEL Approach Ollalie MeadowsElev. 1128m SNOW RAIN ~ 20% April1 SWE/°C
2. Sensitivity using a coupled and uncoupled Atmospheric-Land Model • Atmospheric models (general circulation models – GCMs) use a land scheme to predict moisture fluxes, partition radiation, snow, etc. • The Noah land surface model (LSM) is the land scheme for the atmospheric model (MM5-ECHAM-5) used here. • Major issue is to establish climate baseline (current climate) for sensitivity testing, to make future predictions… • Problem: the GCM used (MM5-ECHAM-5), has an older version of Noah LSM snow model (ver. 2.0), with generally poor snowpack physics producing low biased SWE estimates (compared with obs.). SNOTEL, WA SNOTEL, CA Observations • New snow model Noah 2.8 • Improvments: • Melt water refreeze • More realistic solar radiation absorption Old snow model Noah 2.0
Coupled Model Approach… • First: Attempt to isolate snow sensitivity to temperature change, given potential bias sources: i. Biased snow model; ii. Biases in atmospheric simulation. • Method: Remove land model, Noah 2.0, from the coupled mode and run it separtely (offline) to make snow simulations, and do the same with the improved land model, Noah 2.8 to test snow model bias; both under the following conditions: (1) Using spatially gridded *observations (Tmax, Tmin., Precip, Wind) for the 1990s; (2) Using the extracted GCM forcings (Tmax, Tmin., Precip, Wind) for the 1990s; (3) Shifting observed temperatures to equal GCM temperatures for the 1990s; (4) Manually increase the observed forcing temperatures (warming scenario), and (5) Run with increased GCM temperatures (warming scenario for the 2020s). • Compare these results with the coupled model SWE output: (6) the 1990s; and (7) the 2020s. All simulations at spatial resolution: 1/8° ≈ 12 km Baseline *Maurer, E.P., A.W. Wood, J.C. Adam, D.P. Lettenmaier, and B. Nijssen, 2002, A Long-Term Hydrologically-Based Data Set of Land Surface Fluxes and States for the Conterminous United States, J. Climate 15, 3237-3251
Mean temperature (Nov-Mar): ~ 1° C (1) Observed Forcing 1990s April 1 SWE Δ: Noah 2.8 – Noah 2.0 Noah 2.0 Seasonal Snow water storage Noah 2.8 Monthly snow storage volume: ∫SWE(A)·A dA
Mean temperature (Nov-Mar): ~ -1.5° C (2) GCM Forcings 1990s Δ: Noah 2.8 – Noah 2.0 Noah 2.0 Seasonal Snow water storage Noah 2.8
Mean temperature (Nov-Mar): -1.5° C (3) Obs. forcings with GCM temps Δ: Noah 2.8 – Noah 2.0 Noah 2.0 Seasonal Snow water storage Noah 2.8
Mean temperature (Nov-Mar): ~ 2° C (4) Obs. forcings +1°C 1990s Δ: Noah 2.8 – Noah 2.0 Noah 2.0 Seasonal Snow water storage Noah 2.8
Mean temperature (Nov-Mar): ~ -0.4° C (5) GCM Forcings 2020s Δ: Noah 2.8 – Noah 2.0 Noah 2.0 Seasonal Snow water storage Noah 2.8
ΔMean temperature (Nov-Mar): ~ 1.1° C (6) GCM Outputs 1990s, 2020s Δ: SWEMM5-1990s - SWEMM5-2020s MM5 SWE 2020s Seasonal Snow water storage MM5 – SWE 1990s Baseline
Model sensitivities Asymmetric sensitivities
Baseline Baseline Summary of results
Conclusions… • Estimates of snowpack sensitivity to temperature change (excluding assumptions about precipitation changes) yield a range of potential sensitivities ~ 20 % with 1 outlier: 1. 3 methods employed by *Casola et al (~2008): -Suggest snow water storage has roughly 20% sensitivity to 1°C warming. 2. Present work using coupled and offline large-scale GCM and LSM’s: -Caution must be taken in establishing the baseline, or current climate, from which sensitivities are computed… -GCM has cold bias, inferior snow model, and distribution of precipitation differing from observed, exacerbate disparity in SWE prediction -Preliminary results are generally in agreement with Casola et al. sensitivities… Ultimately, a snow model that can effectively reproduce current conditions one essential component to making realistic estimates of future climates and sensitivities.
Low snow bias for old (coupled) Noah LSM (ver 2.0) Cumulative snow covered days IMS Satellite 1/8° spatial resolution Noah ver. 2.0
Model Improvements… • Improved SWE performance: *Refreeze of melt water, more realistic absorption of solar radiation, turbulent exchange Noah ver. 2.8 ½° spatial resolution Noah ver. 2.0