Download
1 / 17
170 likes | 259 Views
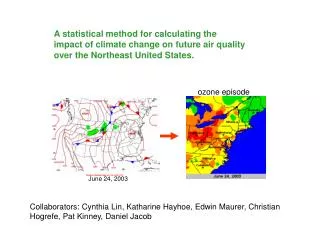
Diagnosing the sensitivity of O 3 air quality to climate change over the United States. Moeko Yoshitomi (moeko@fas.harvard.edu), Daniel J. Jacob, Loretta J. Mickley, Philippe Le Sager, Julia M. Sygiel, Shiliang Wu Department of Earth & Planetary Sciences Harvard University.

E N D
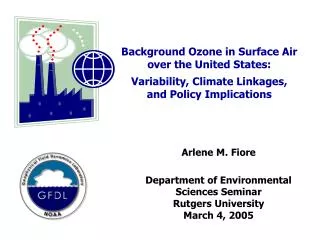
Diagnosing the sensitivity of O3 air quality to climate change over the United States Moeko Yoshitomi (moeko@fas.harvard.edu), Daniel J. Jacob, Loretta J. Mickley, Philippe Le Sager, Julia M. Sygiel, Shiliang Wu Department of Earth & Planetary Sciences Harvard University presented at GCAP Phase 2 Science Team Meeting Harvard University, MA, US October 12th, 2007
Projecting Future O3 Air Quality in the US Δ(2050s-present) in simulated summer daily 8-hr max O3levels [1] Harvard CTM [2] CMU CTM [Wu et al., 2007] [Racherla and Adams, 2006] O3 [ppb] ・ Many regions show substantial future O3 increases (1-5 ppb) due to climate change ・ Spatial patterns of climate-induced increases in O3 is different - where the highest O3 is predicted - how much O3 increases at a maximum
Projecting Future O3 Air Quality in the US Higher isoprene emissions in SE ⇒ O3 ↑ or ↓??? Δ(2050s-present) in simulated summer daily 8-hr max O3levels [1] Harvard CTM [2] CMU CTM [Wu et al., 2007] [Racherla and Adams, 2006] O3 [ppb] isoprene emission [10e-8 g C/m2/s] [g/s] Key issue: modeling of the fate of isoprene emissions over the SE
Uncertain NOx-Isoprene-O3 Chemistry NOx recycled ?? branch ratio?? There is a controversial competition on isoprene effects on O3 O3 ↑ NO2 NO OH Isoprene RO2 k298=1.0x10⁻¹⁰ NO RONO2 (isoprene nitrate) O3 ↓ Deposition O3 O3 ↓ Products Isoprene k298=1.3x10⁻¹⁷
Understanding the Relationship of Surface O3 and Temperature Major Questions from Previous GCAP Research 1. Can we apply observed O3-temperature relationship to validate chemical models used to investigate the sensitivity of surface O3 to climate change? 2. Is the O3-temperature relationship sensitive to assumptions about the fate of isoprene nitrate? Observations Hourly surface O3 concentrations from AIRS/EPA and daily maximum temperatures from NCDC, for JJA 1980-1998, which is gridded at 4x5 Model Simulations [1] GCAP run at 4x5 resolution = GEOS-Chem + calculated GISS GCM meteorology (JJA 1999-2001) [2] GEOS-4 run at 2x2.5 resolution = GEOS-Chem + assimilated GEOS4/GMAO meteorology (JJA 1999-2001)
Regression Analysis on O3 and T Data Sets ・ Daily maximum of 8-hr running average O3 concentrations (MDA8) ・ Daily maximum temperature Approach Reduced-major-axis (RMA) linear regression: to allow for errors in both x and y coordinates [For Question 1 & 2] Analyze the relationship in a gridbox-scale [For Question 2] Analyze the relationship in a regional scale (Northeast: 7 boxes, Southeast: 9 boxes, Midwest, Northwest, Southwest, Central, Mid-Atlantic)
Observed Correlation between O3 and T From RMA linear regression Slope dO3/dT Correlation Coefficient -1 -.5 0 .5 1 -10 5 0 5 10 ・ Sensitivity of O3 to temperature varies across the US ・ The NE shows stronger O3/T correlation than the SE
Observed Correlation between O3 and T From RMA linear regression Slope dO3/dT Correlation Coefficient -1 -.5 0 .5 1 -10 5 0 5 10 ・ Sensitivity of O3 to temperature varies across the US ・ The NE shows stronger O3/T correlation than the SE NE SE
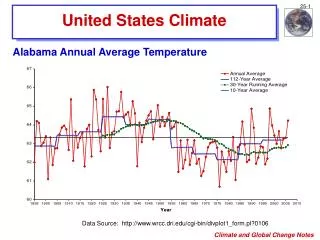
O3 and Temperature Observed by AIRS 150 100 50 0 150 100 50 0 280 300 320 280 300 320 150 100 50 0 150 100 50 0 MDA8 [ppb] 280 300 320 T max [K] 280 300 320 T max [K] Temperature has an inter-annual variability - 19-yr mean/1988 mean/1992 mean; NE: 300.53/302.14/298.79 [K], SE: 305.92/306.10/305.26 [K]
O3 and Temperature Simulated by GCAP 150 100 50 0 150 100 50 0 The GCAP results do not vary too much year-to-year MDA8 [ppb] 280 300 320 280 300 320 150 100 50 0 150 100 50 0 MDA8 [ppb] 280 300 320 T max [K] 280 300 320 NE has stronger O3/T correlation than SE - GCAP O3/T correlations are slightly stronger in both NE and SE than observed O3/Tcorrelations
GCAP Model Captures Correlation Trends 1980-1998 obs 1999-2001 GCAP -1 -.5 0 .5 1 ・ Sensitivity of O3 to temperature varies across the US in both obs. and models ・ Both the observations and GCAP show stronger correlation in the NE than the SE 1999-2001 GEOS4 ・ GEOS4 does not show thedifference between NE and SE that obs. and GCAP model show
GCAP Captures the Variation in dO3/dT Slope Slope of dO3/dT from RMA linear regression 1980-1998 obs 1999-2001 GCAP -10 5 0 5 10 ・ Cool Gulf of Mexico air with low-level O3 gives higher slopes in the SE; nothing to do with local chemistry ・ GEOS4 does not show the difference between NE and SE that GCAP shows 1999-2001 GEOS4
My Future Work [Short-term work] ・ Explore reasons for the differences in O3-T correlation between obs. and models - meteorology issue (e.g., difference between GCAP and GEOS4) - missing chemistry (e.g., isoprene sensitivity analysis) ・ Interpret whether the NE-SE contrast reflects transport or chemistry [Long-term work] ・ Estimate the sensitivity of ozone pollution to future global change with our GCAP model for each SRES scenario ・ Investigate effects of 2000-2050 changes in global anthropogenic emissions and in general circulation to the intercontinental transport of air pollutants to the US
GCAP Phase 2 Science Team meeting at Maxwell Dworkin 223
GCAP Phase 2 Science Team meeting at Maxwell Dworkin 223
GCAP Phase 2 Science Team meeting at Maxwell Dworkin 223
GCAP Phase 2 Science Team meeting at Maxwell Dworkin 223