Download
1 / 1
10 likes | 117 Views
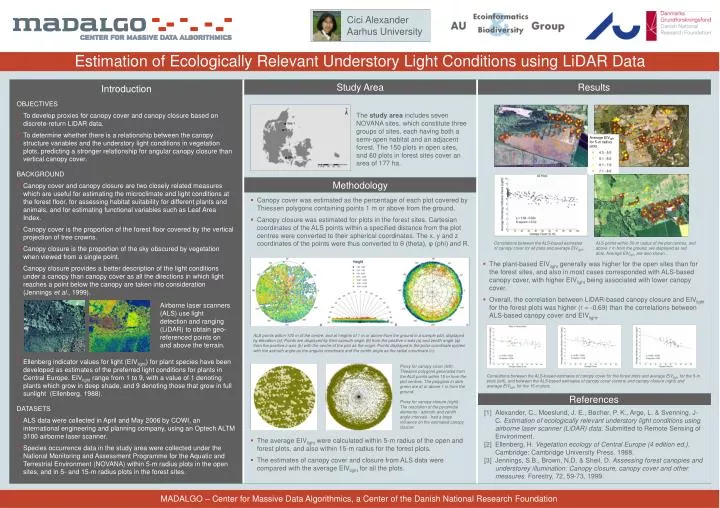
Cici Alexander Aarhus University. Estimation of Ecologically R elevant U nderstory Light C onditions using LiDAR Data.

E N D
Cici AlexanderAarhus University Estimation of Ecologically Relevant Understory Light Conditions using LiDAR Data The study area includes seven NOVANA sites, which constitute three groups of sites, each having both a semi-open habitat and an adjacent forest. The 150 plots in open sites, and 60 plots in forest sites cover an area of 177 ha. Average EIVlight for 5-m radius plots Correlations between the ALS-based estimates of canopy cover for all plots and average EIVlight. ALS points within 50-m radius of the plot centres, and above 1 m from the ground, are displayed as red dots. Average EIVlight are also shown. • The plant-based EIVlight generally was higher for the open sites than for the forest sites, and also in most cases corresponded with ALS-based canopy cover, with higher EIVlight being associated with lower canopy cover. • Overall, the correlation between LiDAR-based canopy closure and EIVlight for the forest plots was higher (r = -0.69) than the correlations between ALS-based canopy cover and EIVlight. • Airborne laser scanners (ALS) use light detection and ranging (LiDAR) to obtain geo-referenced points on and above the terrain. ALS points within 100 m of the centre, and at heights of 1 m or above from the ground in a sample plot, displayed by elevation (a); Points are displayed by their azimuth angle (θ) from the positive x-axis (a) and zenith angle (φ) from the positive z-axis (b) with the centre of the plot as the origin. Points displayed in the polar coordinate system with the azimuth angle as the angular coordinate and the zenith angle as the radial coordinate (c). Proxy for canopy cover (left):Thiessenpolygons generated from the ALS points within 15 m from the plot centres. The polygons in dark green are at or above 1 m from the ground. Proxy for canopy closure (right): The resolution of the pyramidal elements - azimuth and zenith angle intervals - had a large influence on the estimated canopy closure. Correlations between the ALS-based estimates of canopy cover for the forest plots and average EIVlight for the 5-m plots (left), and between the ALS-based estimates of canopy cover (centre) and canopy closure (right) and average EIVlight for the 15-m plots. MADALGO – Center for Massive Data Algorithmics, a Center of the Danish National Research Foundation