Download
1 / 15
200 likes | 439 Views
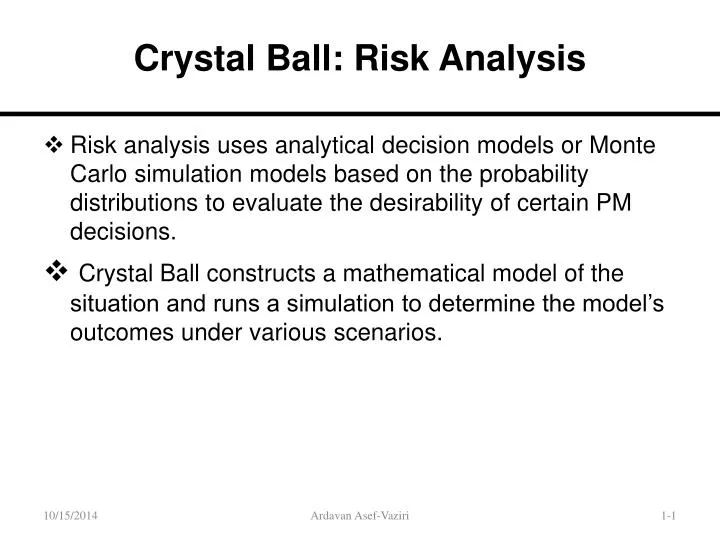
Crystal Ball: Risk Analysis. Risk analysis uses analytical decision models or Monte Carlo simulation models based on the probability distributions to evaluate the desirability of certain PM decisions.

E N D
Crystal Ball: Risk Analysis • Risk analysis uses analytical decision models or Monte Carlo simulation models based on the probability distributions to evaluate the desirability of certain PM decisions. • Crystal Ball constructs a mathematical model of the situation and runs a simulation to determine the model’s outcomes under various scenarios. Ardavan Asef-Vaziri
Risk Analysis: PsychoCeramic’s Case • Open Crystal Ball and make an Excel spreadsheet copy of Table 1-1 (p.20). • Using CB to run a Monte Carlo simulation requires us to define two types of cells in the Excel spreadsheet. • Assumption cells: In Table 1-1, columns B and G, the inflow and the rate of inflation, are the cells that contain variables or parameters that we make assumptions about. • Forecast cells: Cell F17 contains the outcomes (or results) we are interested in forecasting. In PsychoCeramic’s case we want to predict the NPV of the project. Ardavan Asef-Vaziri
Single-Point Estimates of the Cash Flows for PsychoCeramic’s Table 1-1 Ardavan Asef-Vaziri
Estimates for Cash Flow • Table 1-2 contains the Pessimistic, Most Likely, and Optimistic Estimates for Cash Inflows for PsychoCeramic Ardavan Asef-Vaziri
Define Assumption Cells: Estimates Data • In Crystal Ball • Click on cell B7 to identify it as the relevant assumption cell. • Select the menu option Cell at the top of the screen (Excel 2007: skip this step). • Select Define Assumption. CB’s Distribution Gallery is now displayed . Ardavan Asef-Vaziri
Define Assumption Cells: Estimates Data • Select the Triangular box. • CB’s Triangular Distribution dialog box is displayed. In the Assumption Name: enter a descriptive label, for example, Cash Inflow 2010. Then enter the pessimistic, most likely, and optimistic costs from Table 1-2 for the year 2010 in the Min, Likeliest, and Max boxes. Ardavan Asef-Vaziri
Define Assumption Cells: Estimates Data • Click OK (note that the inflow in cell B7 automatically changes to the mean of the triangular distribution). Now repeat steps 1-6 for the remaining cash inflow assumption cells (B8:B15) Ardavan Asef-Vaziri
Define Assumption Cells: Inflation Values • Define assumption cells for the inflation values in column G. • The entry at the beginning of the year 2008 is not discounted so there is not need for an entry in Cell G4. • Select G5 • Select the Normal distribution • In the Assumption Name: enter Inflation Rate • Enter 0.02 for all cells in the Mean textbox, and .0033 in the Std Dev textbox Ardavan Asef-Vaziri
Define Assumption Cells: Inflation Values • Copy the assumption cell G5 to G6:G14 • Excel’s copy and paste commands will not work. CB’s own copy and paste commands must be used to copy the information contained in both assumption and forecast cells. • Place the cursor on cell G5 • Enter the command Cell, then click on Copy Data • Highlight the range G6:G14 • Enter the command Cell, then Paste Data • Note that the year 2017 has two cash inflows, both occurring at the end of the year. Because we don’t want to generate two different inflation rates for 2017, the value generated in cell G14 will be used for both 2017 entries. • In cell G15 enter =G14 Ardavan Asef-Vaziri
Define Forecast Cells (Outcome) • Click on the cell F17 to identify it as containing an outcome. • Select the menu option Cell at the top of the screen (Excel 2007: skip this step). • Select Define Forecast… • In the Forecast Name: textbox enter a descriptive name such as Net Present Value of Project. Then enter a descriptive label such as Dollars in the Units: textbox. • Click OK. ( If there are more than 1 Forecast cells, use the same five steps to define each of them). Ardavan Asef-Vaziri
Three-Point Estimate of Cash Flows and Inflation Rate: Assumption & Forecast Cells Defined Ardavan Asef-Vaziri
CB: Simulation • CB randomly selects a value for each assumption cell based on the probability distributions which we specified and then calculates the net present value of the cell values selected. By repeating this process many times, we can get a sense of the distribution of possible outcomes. • To simulate the model we have constructed 1000 times, select the Run menu. (2007: skip this step) • Select Run Preferences. • Enter 1000 in the Maximum Number of Trials textbox and then click OK. • To perform the simulation, click Run (2007: click Start). Ardavan Asef-Vaziri
CB: Simulation Output • CB summarizes the results of the simulation in the form of a frequency chart that changes as the simulations are executed. Ardavan Asef-Vaziri
Summary of Statistics • CB also provides information about the forecast cell including percentile information, summary statistics, a cumulative chart, and a reverse cumulative chart. • To see the summary statistics for a forecast cell, select View from the Forecast dialog box toolbar and then select Statistics. Ardavan Asef-Vaziri
Probability: NPV ≥ Hurdle Rate • Using the Simulation output display, erase –Infinity from the box in the lower left corner. Type 0 (or 1) in that box and press Enter. • The boxes at the bottom of the output display now shows that given our estimates and assumptions of the cash flows and the rate of inflation, there is a .90+ probability that the project will have an NPV between zero and infinity, that is, the rate of return at or above the 13% hurdle rate. Ardavan Asef-Vaziri