Download
1 / 23
230 likes | 348 Views
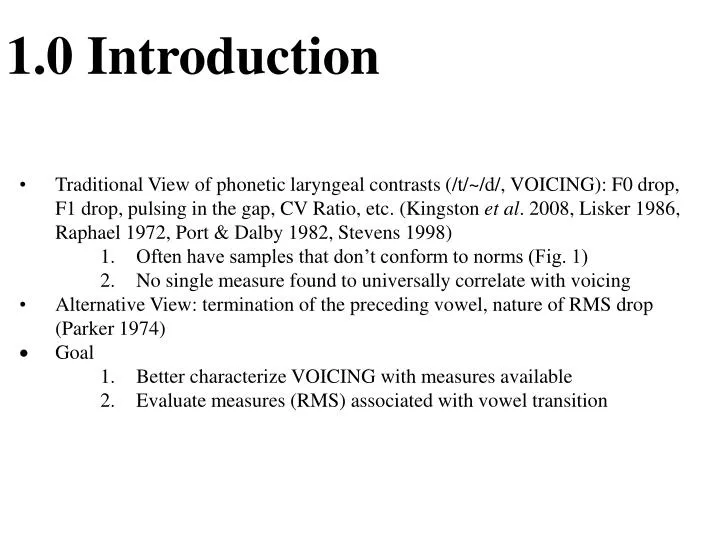
1.0 Introduction. Traditional View of phonetic laryngeal contrasts (/t/~/d/, VOICING): F0 drop, F1 drop, pulsing in the gap, CV Ratio, etc. (Kingston et al . 2008, Lisker 1986, Raphael 1972, Port & Dalby 1982, Stevens 1998) Often have samples that don’t conform to norms (Fig. 1)

E N D
1.0 Introduction • Traditional View of phonetic laryngeal contrasts (/t/~/d/, VOICING): F0 drop, F1 drop, pulsing in the gap, CV Ratio, etc. (Kingston et al. 2008, Lisker 1986, Raphael 1972, Port & Dalby 1982, Stevens 1998) • Often have samples that don’t conform to norms (Fig. 1) • No single measure found to universally correlate with voicing • Alternative View: termination of the preceding vowel, nature of RMS drop (Parker 1974) • Goal • Better characterize VOICING with measures available • Evaluate measures (RMS) associated with vowel transition
Figure 1. Formant plots (a) normal /bat/ (b) normal /bad/ (c) abnormal /bat/ (d) abnormal /bad/. Blue plane is RMS knee, green plane is lingual closure.
2.0 Experiment 1 • Conventional wisdom: Frequency values • Formant transitions will show trend for /t/ vs. /d/ • f0 transition will show well-defined trend for /t/ vs. /d/ • Test energy vs frequency information
2.1 Methodology • N=27 female speakers from Upper Midwest (MN, WI) • Context: bat and bad, isolated and sentence (“Use this new bat”/”Make this one bad”) • X-ray microbeam tongue-tip data • Acoustic Measures • Frequency Characteristics • Change in F1 frequency prior to formant end • Change in f0 frequency prior to formant end • Temporal Energy Characteristics • Formant end: 15 dB drop in F2 from local maximum (Fig. 2) • RMS knee: RMS derivative exceeds negative threshold of -0.33 dB/ms (Fig. 3)
RMS knee RMS drop brought about by something other than occlusion RMS knee RMS drop brought about by occlusion (green line). Increase in rate of RMS drop brought about by occlusion (green line). a) b) Figure 3. RMS and rate of change of RMS (a) bat (b) bad. (a) Syllable final /t/ shows RMS knee prior to occlusion (vertical green) while (b) final /d/ shows RMS knee close to occlusion.
2.2 Results • ANOVA, means for acoustics (Table 1, p<0.05, df = [1, 104]) • Energy factors: significant interactions (Fig. 4) for F2 end (F=30.3) and RMS knee (30.3) • Frequency factors: only significant main effect for f0 change for VOICING (F=5.3)
Gesture F2 db RMS F1 f0 end end knee ΔΔ (ms) (ms) (ms) (Hz) (Hz) /t/ Isolation 266231 201 197 47 (31) (27) (29) (174) (95) Sentence 269 219 188 151 19 (30) (28) (19) (180) (71) /d/ Isolation 328 313 317 226 -6 (36) (37) (39) (89) (10) Sentence 262236 231 192 14 (31) (31) (35) (70) (61) Table 1. Means and standard deviations.
Covariation with lingual closure (r2, Table 2, p<0.05) • Energy factors: significant for both factors in all conditions except /t/ in sentences (Fig. 4) • Frequency factors: no significant covariation r2F2 dB end RMS knee F1 Δ f0 Δ /t/ Isolation 0.76* 0.72* n.s. n.s. Sentence 0.40* n.s. n.s. n.s. /d/ Isolation 0.94* 0.92* n.s. n.s. Sentence 0.93* 0.59* n.s. n.s. Table 2. Covariation with lingual closure. (*p<0.05)
2.3 Discussion • Final /t/ characteristics • RMS knee prior to occlusion (Fig. 3a) • phonation terminates prior to occlusion • Final /d/ characteristics • RMS knee at time of occlusion if present (Fig. 3b) • phonation continues past occlusion • Formant transitions not significant for voicing • f0 transition not significant for voicing
Interpretation • Energy for final /d/ determined by supra-laryngeal gestures (lingual closure and enhancing gestures) • Energy for final /t/ determined by laryngeal gesture (Fig. 5) • Traditional measures of frequency for f0 and F1 weak correlation with voicing at best
hold approach release /d/ phonation enhancing gesture hold approach release /t/ phonation termination gesture Figure 5. Timing diagram. Shows supra-laryngeal gesture for syllable final /d/, laryngeal termination gesture for final /t/.
3.0 Experiment 2 Test role of phonation and relation between energy and frequency • Exploit difference in lower harmonic behavior between final /t/ and /d/ (Fig. 6) • Examine energy behavior in lower harmonics relative to energy in formants
h3 h3 h2 h2 h1 h1 a) b) Figure 6. Harmonic plots (a) bat (b) bad. Final /t/ shows simultaneous end of lower 3 harmonics, final /d/ shows continuation of h1 relative to higher harmonics.
3.1 Methodology • Same data set as Experiment 1 • Acoustic Measures • Frequency Characteristics • Change in F1, F2, F3 frequency prior to formant end • Change in f0 frequency prior to formant end • Temporal Energy Characteristics • H1 end: time to 15 dB drop in first harmonic • H2 end: time to 15 db drop in second harmonic • Formant end: 15 dB drop in F2 from local maximum • H1 energy: average energy over 30 msec prior to formant end for 150-350 Hz (Fig. 7)
F1 F1 F2 F2 F3 F3 h1 h1 a) b) Figure 7. Formant energy and first harmonic energy (a) bat (b) bad. Shading shows energy in first harmonic at formant end (vertical aqua line).
3.2 Results • ANOVA, means for acoustics (Table 3, p<0.05, df = [1, 104]) • Energy factors: significant main effect for VOICING: h1-h2 (F=37.6), energy h1-h2 (F=16.5) and meanenergy h1(F=361.1); for Condition: h1-h2 (F=40.1) • Frequency factors: significant main effect for VOICING: F2 change (F=4.1) and f0 change (F=5.3)
F2 f0 h1-h2 mean ΔΔ (ms) energy h1 (Hz) (Hz) (dB) /t/ Isolation 98 47 181 -67 (427) (95) (102) (3) Sentence 60 19 -73 -67 (383) (71) (139) (3) /d/ Isolation -16 -6 337 -52 (132) (10) (183) (3) Sentence -59 14 174 -54 (91) (61) (231) (5) Table 3. Means and standard deviations for select measures.
Figure 8. Comparison of F2 end with mean H1 energy. Box identifies region of /t/ distinct from /d/, regardless of context.
3.3 Discussion • /t/ vs /d/ difference • Vowel end determined by lingual closure for /d/ • Vowel end determined by laryngeal termination gesture for /t/ • Relation between H1 energy prior to vowel end and VOICING is significant (Fig. 8) • Implications • Confirm importance of vowel duration • Energy levels as opposed to frequency values (Parker 1974) • Energy measures greater correlation with VOICING than traditional measures(f0 delta, F1 delta) • Energy measures during transition informative for consonant voicing in addition to vowels (Jenkins et al. 1983)
4.0 Conclusion • Work to date on speech perception in post-vocalic stops has focused on frequency transitions, percent closure voicing, vowel duration. • Energy characteristics can provide more robust acoustic measures for voicing than traditional measures. • /t/ is characterized by a phonation termination gesture (glottal stop) which has implications for phonological theories. • Going forward: investigate importance of energy in perception.
References Jenkins, J. et al., 1983, Perception & Psychophysics,34, 441-450. Kingston, J. et al., 2008, J Phonetics, 36, 28-54. Lisker, L., 1986. Language & Speech, 29, 3-11. Parker, F., 1974, J Phonetics2, 211-221. Peterson, G. & Lehiste, I., 1960, JASA, 32, 693-703. Port, R. & Dalby, J., 1982, Perception & Psychophysics, 32, 141-152. Raphael, L., 1972, JASA, 51, 1296-1303. Stevens, K. 1998. Acoustic Phonetics, Cambridge, MA: MIT Press. Acknowledgements We would like to thank Eric Raimy for discussion. All mistakes are our own. Contact Info brodgers@wisc.edu tcpurnell@wisc.edu jsalmons@wisc.edu