Download
1 / 30
300 likes | 306 Views
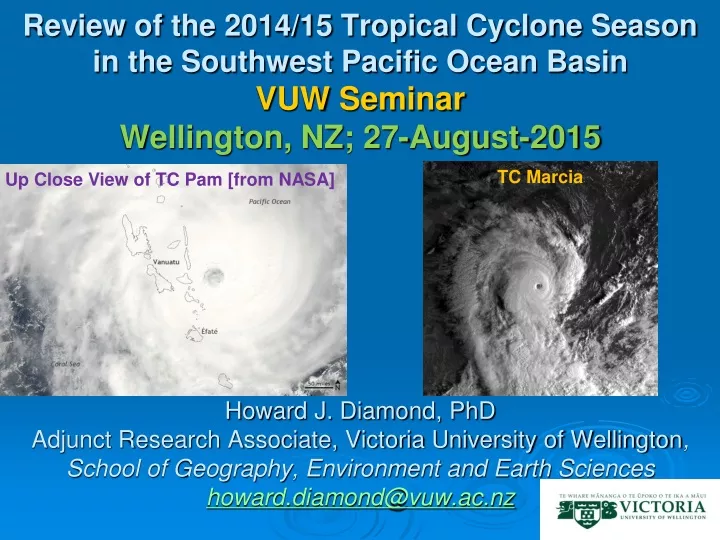
Review of the 2014/15 Tropical Cyclone Season in the Southwest Pacific Ocean Basin VUW Seminar Wellington, NZ; 27-August-2015 Howard J. Diamond, PhD Adjunct Research Associate, Victoria University of Wellington , School of Geography, Environment and Earth Sciences howard.diamond@vuw.ac.nz.

E N D
Review of the 2014/15 Tropical Cyclone Season in the Southwest Pacific Ocean BasinVUW SeminarWellington, NZ; 27-August-2015Howard J. Diamond, PhDAdjunct Research Associate, Victoria University of Wellington, School of Geography, Environment and Earth Scienceshoward.diamond@vuw.ac.nz TC Marcia Up Close View of TC Pam [from NASA]
Agenda • Outlook Prior to the Season • Summary of Activity & Some Unique Seasonal Features • Tropical Cyclone Pam • Impacts • Climatological Conditions • Sub-Tropical Storm “Katie” in late April/early May; and Late Season TC Raquel – Straddling Season Line between June 30/July 1 • Summary
SW Pacific Basin Main Development Area Extent of SW Pacific TC Region No RSMC Responsibility
World Meteorological Organization’s Tropical Cyclone Programme – Regional Specialised Meteorological Centres (RSMC)
Average annual profile of tropical cyclone longitude crossings for the Southern Hemisphere (Natural Break at 135º East) – Kuleshov, 2006 Historical Climatology 7 Australian Region Southwest Pacific Region 6 160º E – Boundary of Monitoring Centres 5 4 3 2 1 135º East – Gulf of Carpentaria 0 35º E 135º E 160º E 110º W
TC Outlook Issued by NIWA – October 2014 Based on Coupled ENSO Index Analog Seasons (Gergis and Fowler, 2005) C Climatology based on Period from 1981-2010
NIWA Outlook Highlights and Results • Six analog TC seasons: 1978/79; 1979/80; 1980/81; 1990/91; 2001/02; and 2012/13 – typified as ENSO-neutral to weak El Niño seasons • 8-12 named TCs expected [11 named TCs] • One Cat 5 TC expected [2 Aussie Cat 5 TCs – Marcia and Pam] – Furthermore, Pam was a Saffir-Simpson Cat 5 TC • Chances of 2 or more TCs passing near Vanuatu • Reduced activity for early part of season (Nov-Jan) [From Nov-Jan there were only 2 named storms, but 8 Invests or TDs] • More active late part of the season (Feb-Apr) [From Feb-Apr there were 6 named storms, and 4 Invests or TDs] • Outside of season (May-Jun) [2 named storms*, and 3 Invests or TDs] * One – a sub-tropical storm well east of the normal basin.
1970-2010 Full Season Climatological Distribution of TCs per SPEArTC Dataset
Coupled ENSO Index (CEI) • The CEI is an index used to jointly indicate ocean and atmosphere conditions associated with ENSO (Gergis and Fowler, 2005). • The primary components of the CEI are the Southern Oscillation Index (SOI) and the Niño3.4 (N3.4) index • Each of these indices is smoothed (as explained in Gergis and Fowler, 2005) and minimum threshold values indicate whether the atmosphere (SOI) or ocean (N3.4) indicates if an ENSO phase is present. • When both indices indicate the same ENSO state, the ocean-atmosphere system is considered to be well-coupled (either a NIÑO or NIÑA style event). • When only the N3.4 index or SOI indicates ENSO is present, a N3.4 NIÑO/N3.4NIÑA or SOI NIÑO/SOI NIÑA style of event is suggested, respectively.
Preliminary TC Tracks – 25 Total Tracks 11 Named Storms plus 1 Sub-Tropical Storm
TC Storm Intensities The increased proportion of major TCs over the past 20 years is statistically significant with a t-test score of p > .005 (19 degrees of freedom) Australian TC Intensity Scale http://www.bom.gov.au/cyclone/about/intensity.shtml
Highlights • Early on 13-March, the JTWC determined Pam reached its peak one-minute sustained winds of 270 km/h (146 knots) as it neared Vanuatu. • Several hours later, the TC began to curve towards the south-southeast, allowing Pam to pass just east of Efate in Vanuatu. At that time, the Fiji Met Service (FMS) estimated Pam as having record-breaking 250 km/h (135 knots) ten-minute sustained winds. • The storm's winds gradually slowed afterwards as Pam tracked west of Tafea. However, the FMS indicated that the cyclone's pressure dropped further to a minimum of 896 hPa on 14-March, making Pam the second most intense TC in the South Pacific basin after Cyclone Zoe in 2002. MJO maxed out at 4.6 on 16-March • This intensity was short-lived, however, as Pam's central pressure began rising shortly thereafter as the storm accelerated southeastward. Pam weakened to Category 4 intensity on 15-March after maintaining Category 5 intensity for 36 hours. • Shortly after, the storm's eye faded away and Pam's low level circulation became displaced from its associated thunderstorms, signaling a rapid weakening phase. Later on 15-March advisories were discontinued and Pam entered a phase of extratropical transition affecting northeastern New Zealand. The system moved eastwards, and eventually dissipated over the waters of the South Pacific by 23-March.
TC Pam’s Power in Stripping Vegetation from Tanna Island in Vanuatu Aerial View Before Aerial View After Landsat Before Landsat After
Sea Surface Temperature (SST) Anomalies for March 2015 [NOAA OISST Data; + indicates genesis position of TC Pam] Blue – Negative; Red - Positive
Vorticity Anomalies on the Day of Cyclogenesis for TC Pam (+) [ERA-40 1ºx1º Data] Blue – Negative; Red - Positive
Wind Shear & 700-hPa Wind Anomalies on the Day of Cyclogenesis for TC Pam (+) [ERA-40 1ºx1º Data] Blue – Negative; Red - Positive
Mean Sea Level Pressure (MSLP) Anomalies Across the Track of TC Pam (+) [ERA-40 1ºx1º Data] Blue – Negative; Red - Positive
Geopotential Height (GPH) Anomalies Across the Track of TC Pam (+) [ERA-40 1ºx1º Data] Blue – Negative; Red - Positive
MJO - Combined EOF analysis using OLR, 850-hPa zonal wind & 200-hPa zonal wind as input. 850-hPa Velocity Potential (NOAA/CPC) West Indian East Indian West Maritime East Maritime Wheeler and Hendon, 2004 West Pacific Central Pacific Western Hemisphere Africa
Birth of Twins on 10-March-2015: Pam (SH) and Bavi (NH) • An exceptionally strong MJO, and an equatorial Rossby (ER) wave (red). • The MJO was a bit fast, so it was borderline MJO/Kelvin wave. • Westerly winds extremely strong at the dateline • Referred to an event that was “biblical” in proportion
A Second Set of Twins [30-June-2015] • The second set was Chan-Hom and Raquel, which are right on top of each other around June 30 near 150E. • The set up was very similar, though less of an Equatorial Rossby wave signal. • This particular MJO was associated with eleven TCs spanning from Ashobaa in the Arabian Sea to Claudette in the Atlantic. • TC Raquel formed near the Solomon Islands, and was the first named TC to exist in the South Pacific Ocean during July on record, while it was the third TC on record in the Australian region. Typhoon Chan-Hom TC Raquel
Sub-Tropical Storm “Katie” from 29-April to 5-May • Outside of any RSMC (just off Chilean coast) • To be documented in a Nature paper to be entitled “A Pacific Basin Sub-Tropical Cyclone off the Chilean Coast” • Analyzed by Steve Young from the Australian Severe Weather Web Site; and Brenden Moses from NOAA
Sub-Tropical Storm “Katie” (+ - Genesis) [NOAA OISST Data; + indicates genesis position of TC Pam] Blue – Negative; Red - Positive
Summary • Active TC season that had a very good seasonal outlook prior to the season • Two Australian Category 5 TCs – Marcia and Pam; with Pam being a Category 5 TC on the Saffir-Simpson Scale – most powerful TC since Zoe in 2002 • Two twin cyclone events as a result of strong westerly waves in March (Pam/Bavi) and in June (Raquel/Chan-Hom) • Latest time for a named storm (Raquel) in the SW Pacific Basin (30-June) • Unique Sub-Tropical storm (“Katie”) outside of any • The 2015/16 could be off to an early start • TC 01P formed in early August 2015 • Last big El Niño season in 1997/98 had 2 TCs in October 1997 • Seasonal Outlook will be due out by mid-October 2015 and it will be interesting to see what is in store • My thanks and recognition to Steve Young at the Australian Severe Weather site at http://www.australiasevereweather.com/; Matthew Ford at NZ Metservice, and the BoM for data that allowed me to do the preliminary TC tracks here. Still awaiting official best tracks data from both RSMCs Nadi and Wellington.
Thank You - Any Questions?? Thank you Keeling CO2 Observatory at Mauna Loa Damage from TC Heta in 2004