Download
1 / 15
160 likes | 431 Views
Working With the P-Wave and S-Wave Chart. Things found using the Chart. Travel time – time a seismic wave takes to travel from epicenter to city (seismic station). Epicenter distance – The distance in kilometers (km) between the city and the epicenter (radius of the circle drawn on map).

E N D
Working With the P-Wave and S-Wave Chart
Things found using the Chart • Travel time – time a seismic wave takes to travel from epicenter to city (seismic station). • Epicenter distance – The distance in kilometers (km) between the city and the epicenter (radius of the circle drawn on map). • When given or using the travel time for one wave to travel the distance. • When given or using Difference in arrival time between P & S waves (lag time).
Notice the vertical axis This represents TIME (in minutes!) Let’s enlarge a small section
Between each minute, we notice that there are 3 segments. If there are 60 seconds in a minute, each one of these segments must be ________seconds. 20
What would this time be? 2 minutes, 20 seconds
Notice the horizontal axis This represents DISTANCE (in thousands of Kilometers!) Let’s enlarge a small section
1,000km 2,000km 1,200km 1,800km So what would this distance be? 1,400km 1,600km Fill these in... 5,400km
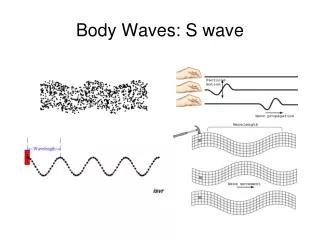
There are also two curves on this chart that display the way different earthquake waves behave.
S-Wave P-Wave
This chart can be used for answering many different questions! Let's try a few examples How long does it take an S-Wave to travel 5,000km (travel time)? Go to the chart!
Another example... The recording station at a city tells us it took 6 minutes and 20 seconds for the P-Wave to reach that city. How far away from the epicenter (epicenter distance) must the seismograph in this city be? Go to the chart!
Another example... I know that there was a 7 minute difference in the arrival of my P and S waves. How far away from the epicenter must I be? Go to the chart!
Slide your scrap paper up until the tick marks match up with the curves… 5,400km Mark off 7 minutes on scrap paper…