Download
1 / 12
120 likes | 302 Views
Steve Paulone Facilitator. Financial Ratios. Things to consider concerning financial ratios:. A ratio by itself means very little – you need to compare that result with: a prior period history competitor company results or with industry averages

E N D
Steve Paulone Facilitator Financial Ratios
Things to consider concerning financial ratios: • A ratio by itself means very little – you need to compare that result with: • a prior period history • competitor company results • or with industry averages to get a real story about the company performance
Things to consider concerning financial ratios: • What aspects of the firm are we attempting to analyze? • What information goes into computing a particular ratio and how does that information relate to the aspect of the firm being analyzed? • What is the unit of measurement (times, days, percent)? • What are the benchmarks used for comparison? What makes a ratio “good” or “bad?”
Categories of Financial Ratios • Profitability ratios: Efficiency of operations and how that translates to the “bottom line” • Short-term solvency, or liquidity, ratios: The ability to pay bills in the short-run • Long-term solvency, or financial leverage, ratios: The ability to meet long-term obligations • Asset management, or turnover, ratios: Efficiency of asset use • Market value of ratios: How the market values the firm relative to the book values
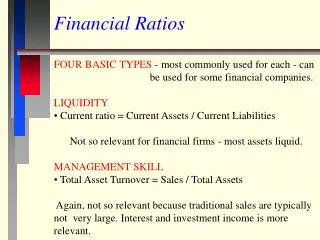
Profitability Measures These measures are based on book values, so they are not comparable with returns that you see on publicly traded assets. • Gross Profit margin = Gross profits / sales • Operating Profit margin = Earnings before interest & taxes (EBIT) / sales • Net Profit margin = Net Earnings available to common stockholders / sales • Return on assets = • Net Earnings available to common stockholders / total assets • Return on equity = • Net Earnings available to common stockholders / total equity
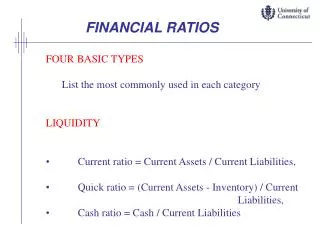
Short-term Solvency, or Liquidity, Ratios • Current Ratio = current assets / current liabilities • Quick Ratio = (current assets – inventory) / current liabilities • Cash Ratio = cash / current liabilities • NWC (Net Working Capital) to TA = (current assets – current liabilities) / total assets
Debt Ratios or Long-Term Solvency Measures • Debt to Total Assets = Total Debt / Total Assets • Total debt ratio = (total assets – total equity) / total assets variations: debt/equity ratio = (total assets – total equity) / total equity • Long-term debt ratio = long-term debt / (long-term debt + total equity) • Times interest earned ratio = EBIT / interest expense • Cash coverage ratio = (EBIT + depreciation) / interest
Asset Management, or Turnover, Measures • Average Collection Period = accounts receivable/ Average daily Credit sales • Receivables turnover = sales / accounts receivable • Inventory turnover = sales / inventory • Days’ sales in inventory = 365 days / inventory turnover • Total asset turnover = sales / total assets
Market Value Measures • Price-earnings ratio = price per share / earnings per share • Earnings per share = net income / shares outstanding • Market-to-book ratio = market value per share / book value per share
Why Evaluate Financial Statements • Internal Uses – evaluate performance, look for trouble spots, and generate projections • External Uses – making credit decisions, evaluating competitors, assessing acquisitions
Choosing a Benchmark • Time-Trend Analysis – look for significant changes from one period to the next • Peer Group Analysis – compare to other companies in the same industry, use SIC or NAICS codes to determine the industry comparison figures
Problems with Financial Statement Analysis • no underlying financial theory • finding comparable firms • what to do with conglomerates, multidivisional firms • differences in accounting practices • differences in capital structure • seasonal variations, one-time events