Download
1 / 18
180 likes | 266 Views
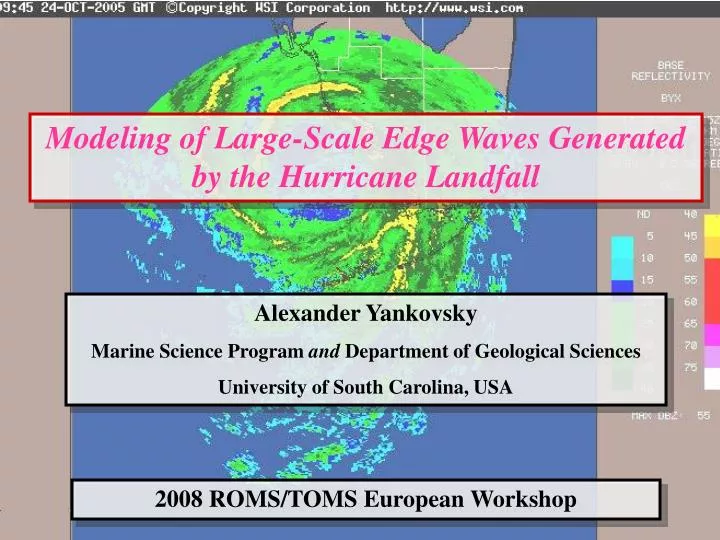
Modeling of Large-Scale Edge Waves Generated by the Hurricane Landfall. Alexander Yankovsky Marine Science Program and Department of Geological Sciences University of South Carolina, USA. 2008 ROMS/TOMS European Workshop. Acknowledgements: National Science Foundation

E N D
Modeling of Large-Scale Edge Waves Generated by the Hurricane Landfall Alexander Yankovsky Marine Science Program and Department of Geological Sciences University of South Carolina, USA 2008 ROMS/TOMS European Workshop
Acknowledgements: • National Science Foundation • US Geological Survey, Florida Integrated Science Center • Drs. Eduardo Patino, Burl Goree (USGS)
Time series of storm surge Wilma’s landfall
Long waves trapped in the coastal ocean: • Subinertial coastal trapped waves (σ≤f); • propagate with the coast on their right in NH, • the effects of Earth’s rotation are crucial. • Edge waves (σ>f); refraction of long gravity • waves, propagate in both directions
ROMS, 2D configuration bc: radiation Atmospheric vortex in gradient wind balance bc: Chapman bc: wall bc: radiation
Standard Case: • Pressure anomaly in the cyclone’s center is 3 hPa (wind is ~ 12 m/s) • Translation speed of the storm system is 10 m/s eastward • Quadratic bottom stress, C =10-3; • f =6.3×10⁻⁵ s-1 (26 °N); • Spatial resolution: Δx = Δy = 2.5 km
Standard case: phase diagram Temporal and alongshore evolution of free surface at the coast
Linear shallow water equations on f-plane Boundary conditions: Assume: Q =kf/ω AX=μX (y=0) (y=L) MATLAB EIG routine
Standard case, dispersion diagram of the edge wave modes propagating downstream (solid line) and upstream (dashed line)
Case B Us= 5 m/s Case C Us= 3 m/s
Us=10 m/s Us=5 m/s Us=3 m/s
Case D Us = 8.66 m/s Vs = -5 m/s Case E Us = 8.66 m/s Vs = 5 m/s
Case F: strong wind ΔP = -20 hPa (max wind ≈ 34 m/s); C = 3×10⁻³
Conclusions ·Hurricane Wilma’s landfall generated a long-wave pulse traveling downstream (northwestward) along the coast. This wave pulse lasted ~6 hrs and its height was ~1.5 m in the detided sea level. ·The wave pulse is identified as an edge wave of large spatial and temporal scales. Numerical calculations show that such waves can be generated by a fast-moving storm crossing the continental shelf at the close-to-normal angle. · Zero-mode edge waves dominate the response. Their structure in the model is very close to the theoretical estimates.