Download
1 / 32
320 likes | 435 Views
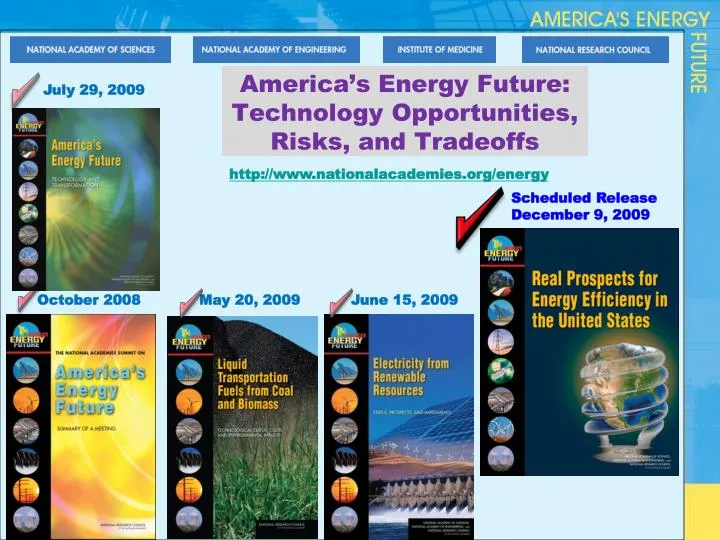
America’s Energy Future: Technology Opportunities, Risks, and Tradeoffs. July 29, 2009. http://www.nationalacademies.org/energy. Scheduled Release December 9, 2009. October 2008. May 20, 2009. June 15, 2009. America’s Energy Future Project Sponsorship.

E N D
America’s Energy Future: Technology Opportunities, Risks, and Tradeoffs July 29, 2009 http://www.nationalacademies.org/energy Scheduled Release December 9, 2009 October 2008 May 20, 2009 June 15, 2009
America’s Energy FutureProject Sponsorship To minimize any perception of bias, a broad range of sponsors was engaged: U.S. Department of Energy Kavli and Keck Foundations Dow Chemical, General Electric, Intel, General Motors, and BP The National Academies
America’s Energy Future: Project Structure 63 committee & panel members 22 consultants 12 principal staff dozens of workshop participants 62 reviewers of 5 reports
December 2009 National Research Council America’s Energy Future Panel on Energy Efficiency Technologies Lester Lave, Chair Maxine Savitz, Vice-Chair Public release: December 9, 2009 4
Lester B. Lave – (Chair) Carnegie Mellon University Maxine L. Savitz– (Vice-Chair) Honeywell Inc. (retired) R. Stephen Berry, University of Chicago Marilyn A. Brown, Georgia Institute of Technology Linda R. Cohen, University of California, Irvine Magnus G. Craford,LumiLeds Lighting Paul A. DeCotis, Long Island Lighting Authority James H. DeGraffenreidt, Jr., WGL Holdings, Inc. Howard Geller, Southwest Energy Efficiency Project David B. Goldstein, Natural Resources Defense Council John B. Heywood, Massachusetts Institute of Technology Alexander MacLauchlan, E. I. du Pont de Nemours & Company (retired) William F. Powers, Ford Motor Company (retired) Arthur H. Rosenfeld, California Energy Commission Daniel Sperling, University of California, Davis America’s Energy FuturePanel on Energy Efficiency Technologies 5
Potential for Energy Efficiency? • Replace incandescent lamps with CFL: 6.4% improvement • Replace CFL with LED (2013): 12.5% improvement • Conclusion: Tremendous potential for efficiency 6
Total U.S. Energy Use by Sector, 2008(direct fuel use plus purchased electricity & apportioned losses) 8
From the America’s Energy Future report…… Finding 1: Potential for Transformational Change With a sustained national commitment, the United States could obtain substantial energy-efficiency improvements, new sources of energy, and reductions in greenhouse gas emissions through the accelerated deployment of existing and emerging energy-supply and end-use technologies. “Bucket 1” “Bucket 2” “Bucket 3” 9
Potential for Cost-Effective Annual U.S. Energy Savings (quadrillions of Btus) 10
U.S. Energy Efficiency Potential(Quadrillions of Btus [quads]) U.S. energy use (2008): 101 quads EIA projected U.S. energy use (2030): 118 quads Energy efficiency savings potential: 35 quads saved Net U.S. 2030 energy use: 83 quads 35 quads/yr savings potential by 2030, saving money & energy 11
From the America’s Energy Future report…… Finding 2: Energy Efficiency Potential The deployment of existing energy-efficiency technologies is the nearest-term and lowest-cost option for moderating our nation’s demand for energy, especially over the next decade. 15 Percent (15-17 Quads) by 2020 30 Percent (32-35 Quads) by 2030 NOTE: Even greater savings would be possible with more aggressive policies and incentives. 12
Overarching Finding: Energy-efficient technologies for residences and commercial buildings, transportation, and industry exist today, or are expected to be developed in the normal course of business, that could potentially save 30 percent of the energy used in the U.S. economy while also saving money. If energy prices are high enough to motivate investment in energy efficiency, or if public policies are put in place that have the same effect, U.S. energy use could be lower than business-as-usual projections by 19-22 quadrillion Btu (17-20 percent) in 2020 and by 30-36 quadrillion Btu (25-31 percent) in 2030. 14
Overarching Finding: The full deployment of cost-effective, energy-efficient technologies in buildings alone could eliminate the need to add to U.S. electricity generation capacity. Estimated electricity savings in buildings exceeds the forecast for new net electricity generation in 2030, which means implementing these efficiency measures would mean that no new generation would be required except to address regional supply imbalances, replace obsolete generation assets, or substitute more environmentally benign generation sources. 15
Potential Electricity Savings in Commercial and Residential Buildings, 2020 and 2030 16
Cost of Conserved Energy and Energy Savings Potential for Electricity Efficiency Technologies in Buildings, 2030 17
Potential Natural Gas Savings in Commercial and Residential Buildings in 2020 and 2030 18
Cost of Conserved Energy and Energy Savings Potential for Natural Gas Efficiency Technologies in Buildings, 2030 19
Potential Industrial Energy Savings in 2020 Relative to 2007 20
Potential Reduction in U.S. Gasoline Consumption from Light Duty Vehicles in 2020 Relative to 2007 21
Formidable Barriers to Energy Efficiency 22 Pricing doesn’t reflect scarcity & externalities Lack of knowledge/information Landlord-tenant, builder-buyer Enough demand to lower production costs Imperfect installation Enacting & enforcing legislation & regulations Access to credit Poor second-hand market
Per-Capita Electricity Consumption in California, New York, and the United States, 1990-2006 23
Overarching Finding: Long-lived capital stock and infrastructure can lock in patterns of energy use for decades. Thus, it is important to take advantage of opportunities (during the design and construction of new buildings or major subsystems, for example) to insert energy-efficient technologies into these long-lived capital goods. 24
U.S. Energy Intensity (Btu/$ GDP), 1850-2006 1919-2006 75% reduction in Btu/$ of GDP 1973-2006 50% reduction in Btu/$ of GDP About 50% of reduction is pure efficiency 25
Energy Use in Selected Countries, 2005 About half of the US-Denmark difference is efficiency and half is lifestyle (the bundle of goods & services) 26
Recap of Overarching Findings Finding 1: Energy-efficient technologies exist today, or are expected to be developed that could save 30 percent of the total U.S. energy use. With higher energy prices or policy measures U.S. energy use could be 17-20 percent lower in 2020 and 25-31 percent lower in 2030. Finding 2: Deployment energy-efficient technologies in buildings alone could eliminate the need to add to U.S. electricity generation capacity through 2030. Finding 3: Barriers to improving energy efficiency are formidable. Overcoming them will require significant public and private support, as well as sustained initiative, as demonstrated in some states. Finding 4: Since long-lived capital stock and infrastructure lock in energy use patterns for decades, it is important to incorporate energy-efficient technologies in the design and construction of new buildings or major subsystems. 27
Additional Information on the America’s Energy Future Effort http://www.nationalacademies.org/energy For more information: Peter D. Blair, Ph.D. Executive Director, Division on Engineering and Physical Sciences National Research Council 500 Fifth Street, NW Washington, DC 20001 pblair@nas.edu 28
Relative Fuel Consumption of Future Cars By Powertrain (at 100 Percent ERFC) 29
Potential Reductions in Vehicle Petroleum Use and Greenhouse Gas Emissions from Vehicle Efficiency Improvements Through 2035 30
Estimated Economic Potential for Energy-Efficiency Improvements in Industry Year 2020: Sector-wide & Selected Subsectors/Technologies 31
Plausible Shares of Advanced Light-Duty Vehicles in the New Vehicle Market by 2020 and 2035 32