Download
1 / 83
840 likes | 1.05k Views
Using Soil Color to Assess Hydrology. M.J. Vepraskas Soil Science Dept. NCSU. Modified March 2008. Seasonal High Water Tables. Depth to seasonally-saturated soil layers determines whether soil is: Suitable for a home site A jurisdictional wetland.

E N D
Using Soil Color to Assess Hydrology M.J. Vepraskas Soil Science Dept. NCSU Modified March 2008
Seasonal High Water Tables Depth to seasonally-saturated soil layers determines whether soil is: • Suitable for a home site • A jurisdictional wetland
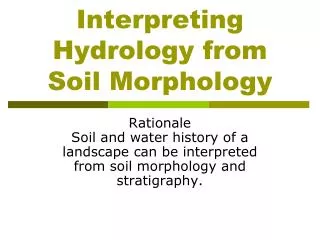
Determining Depth to Seasonal Saturation • Find depth to Low Chroma or gray soil colors • These colors mark the top of the seasonal high water table (SHWT)
Depth of seasonal high water table
Problems with Using Soil Color to Detect Seasonal Saturation • Colors are not reliable indicators when soils have been drained. • We don’t know how often or how long a soil is saturated at a given depth from color alone.
Problems cont’d:New Needs Land-use assessments may require information on frequency and duration of saturation--over the long term (40+ yrs)
Examples • Wetlands--must be saturated for 5% of growing season for >5 out of 10 years • Soils using septic systems-- must not be saturated for >14 d in 7 out of 10 years
Objectives 1. Review basics of oxidation-reduction chemistry, and how it changes colors.
Objectives 2. Review a method that calibrates percentages of redox. features (gray colors) to long-term saturation frequency and duration. 3. Review applications of results.
Conditions needed to Reduce Iron Oxides • Organic matter must be present (source of e-) • Air must not enter soil (soil must be saturated)
Conditions needed to Reduce Iron Oxides cont’d. • Bacteria must decompose organic matter (Temps.> 42o F) • Dissolved O2 in water must be removed (soil is anaerobic). • Nitrate and Mn oxides can’t be present either.
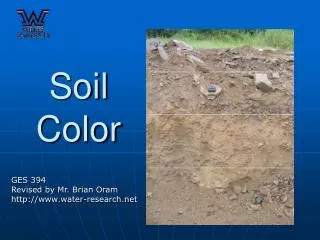
Gray color comes from stripped quartz grains
Redox reactions determine how much gray color forms in wet soils Redox reactions act for 1 day/yr Soil has 10% gray color Soil A saturated for 20 days/yr Redox reactions act for 20 days/yr Soil has 60% gray color Soil B saturated for 20 days/yr
Objectives 2. Review a method that calibrates percentages of redox. features (gray colors) to hydrology. 3. Review applications of results.
Methods How to get 40 yrs of daily water table data
4-Step Approach Compute 40 yr of daily water table levels-during growing season Calibrate model to predict water table level from rainfall Relate the likelihood of meeting wetland hydrology to field indicators Estimate how many years met wetland hydrology
Basic Idea Calibrate percentages of redoximorphic features to long-term water table data
Wet Flats Interstream divides in the Coastal Plain Functions are Defined for Specific Wetland Types
Wet Flat Landscapes Wet Flats Daniels et al, 1999
Soil Series (Ultisols) at Two Sites Goldsboro Lynchburg: not hydric Lenoir: not hydric Rains: hydric (F13) Leaf: hydric (F3)
Hydrologic Modeling • DRAINMOD was calibrated for each soil plot • Calibrated models were used to compute daily water table levels for 40-yr period for each soil plot
Landscapes Studied Wells in plots Hydric Soils (4 reps/site) Upland Soils (4 reps/site)
Saturation Parameters • Minimum Duration of Saturation: lag between start of saturation and Fe reduction • Saturation Frequency: how often the Minimum Duration of Saturation occurs over time
Redox electrode station, automated with Data logger and solar panel.
Finding Lag Times Saturation Lag Anaerobic conditions occur after 4 weeks Aerobic Redox Potential Anaerobic Time (d) 0 Anaerobic 10 20 30 40
How long does it take a soil to become anaerobic once it saturates?
Minimum Durations of Saturation needed for Anaerobic Conditions
Minimum Durations of Saturation and Anaerobic Conditions • Vary with depth for a given site • Average minimum was 21 days (winter) • Shorter durations of saturation may occur in summer, and where organic matter contents are greater.
30 Biological Zero 20 Soil Temp (C0) 10 0 Jan Aug Dec Average Daily Soil Temp.(NC)
Saturation Events • Needed a variable that combined saturation frequency and duration • Variable used was: Saturation Event Index
Saturation Events • Average number of times per year • Soil saturates for 21 d or longer • Computed over 40 year period
Saturation Events % Gray Color 15 cm sections 0 0 0 0 3 0.1 20 1 25 0.7 30 0.6
Results How accurate were the modeling results?
Model Simulation Results Predicted and measured water table levels differed by <15 cm for most plots at both sites over a 3-yr. period
Site 1 Redox depletions (%) Average no. of Saturation Events/yr
Site 1 Redox depletions (%) Average no. of Saturation Events/yr
Soil at 75 cm Contains 60% redox depletions, Has a Saturation Event Index of 2, and is saturated for: 42 to 62 d each year
Redox depletions (%) Saturation doesn’t occur each yr Average no. of Saturation Events/yr
When Saturation Events < 1 Soil saturates for >21 d less often than every year. • If SE is 0.5, soil saturates every other year. • If SE is 0.1, soil saturates once in 10 years
Question • If a soil has 3% low chroma colors in a horizon that saturates once in 10 years, are the colors relict?
Answer • No • Colors are formed during infrequent saturation events. • To document saturation you must monitor site for about 10 yrs.
Objectives 3. Review applications of results. Relate indicators to: Wetland Hydrology Technical Standard Seasonal High Water Table
Wetland Hydrology Requirements • Soil must be saturated to surface for 5% of growing season (14 d) in at least 5 out of 10 years.
Are Field Indicators Related to Wetland Hydrology? Wetland hydrology was simulated using DRAINMOD. Computed the number of years, over a 40-yr period, that wetland hydrology occurred during the growing season. One site had an umbric surface, the other a depleted matrix.
Field Indicators Umbric Surface (F13) A layer of soil 15 cm or more thick, with value 3 or less and chroma 1 or less, underlain by layer with chroma 2 or less.
Umbric Surface • Field Indicator • (F13) • Surface is 15+ cm • thick, with • Value 3 or less • and chroma 1 or less, • underlain by a layer • With chroma 1 or less
Field Indicators cont’d. Depleted Matrix (F3) • A layer of soil 15 cm or more thick, with • >60% redox depletions (grays) and • >2% redox concentrations (red mottles)