Download
1 / 61
620 likes | 727 Views
Using Physics to Assess Hurricane Risk. Kerry Emanuel Massachusetts Institute of Technology. Risk Assessment Methods. Methods based on hurricane history Numerical Simulations Downscaling Approaches. 3 Cat 3 Storms in New England. 3 Cat 5 Storms in U.S. History.

E N D
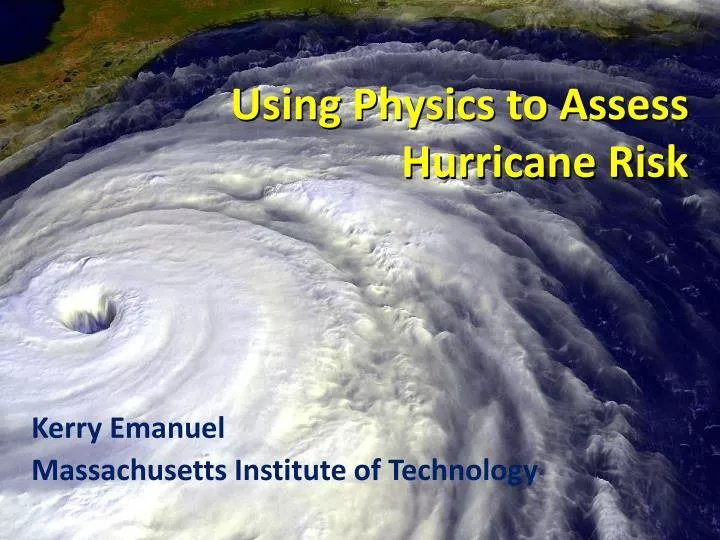
Using Physics to Assess Hurricane Risk Kerry Emanuel Massachusetts Institute of Technology
Risk Assessment Methods • Methods based on hurricane history • Numerical Simulations • Downscaling Approaches
U.S. Hurricane Damage, 1900-2004, Adjusted for Inflation, Wealth, and Population
Some U.S. Hurricane Damage Statistics: • >50% of all normalized damage caused by top 8 events, all category 3, 4 and 5 • >90% of all damage caused by storms of category 3 and greater • Category 3,4 and 5 events are only 13% of total landfalling events; only 30 since 1870 • Landfalling storm statistics are grossly inadequate for assessing hurricane risk
Issues with Historically Based Risk Assessment • Historical record too short to provide robust assessment of intense (damaging) events • Numerous quality problems with historical records • History may be a poor guide to the future, owing to natural and anthropogenic climate change
Using Global and Regional Models to Simulate HurricanesThe Problem: • Global models are far too coarse to simulate high intensity tropical cyclones • Embedding regional models within global models introduces problems stemming from incompatibility of models, and even regional models are usually too coarse • Models to expensive to run many times.
Histograms of Tropical Cyclone Intensity as Simulated by a Global Model with 50 km grid point spacing. (Courtesy Isaac Held, GFDL) Category 3
To the extent that they simulate tropical cyclones at all, global models simulate storms that are largely irrelevant to society and to the climate system itself, given that ocean stirring effects are heavily weighted towards the most intense storms
What are the true resolution requirements for simulating tropical cyclones?
Numerical convergence in an axisymmetric, nonhydrostatic model (Rotunno and Emanuel, 1987)
Another Major Problem with Using Global and/or Regional Models to Simulate Tropical Cyclones: Model TCs are not coupled to the ocean
Our Solution: Drive a simple but very high resolution, coupled ocean-atmosphere TC model using boundary conditions supplied by the global model or reanalysis data set
CHIPS: A Time-dependent, axisymmetric model phrased in R space • Hydrostatic and gradient balance above PBL • Moist adiabatic lapse rates on M surfaces above PBL • Boundary layer quasi-equilibrium • Deformation-based radial diffusion
Ocean Component: ((Schade, L.R., 1997: A physical interpreatation of SST-feedback. Preprints of the 22nd Conf. on Hurr. Trop. Meteor., Amer. Meteor. Soc., Boston, pgs. 439-440.) • Mixing by bulk-Richardson number closure • Mixed-layer current driven by hurricane model surface wind
Application to Assessing Tropical Cyclone Risk in a Changing Climate
Approach: Step 1: Seed each ocean basin with a very large number of weak, randomly located cyclones Step 2: Cyclones are assumed to move with the large scale atmospheric flow in which they are embedded, plus a correction for beta drift Step 3: Run the CHIPS model for each cyclone, and note how many achieve at least tropical storm strength Step 4: Using the small fraction of surviving events, determine storm statistics. Details: Emanuel et al., BAMS, 2008
200 Synthetic U.S. Landfalling tracks (color coded by Saffir-Simpson Scale)
6-hour zonal displacements in region bounded by 10o and 30o N latitude, and 80o and 30o W longitude, using only post-1970 hurricane data
Calibration Absolute genesis frequency calibrated to North Atlantic during the period 1980-2005
Genesis rates Western North Pacific Southern Hemisphere Eastern North Pacific North Indian Ocean Atlantic Calibrated to Atlantic
Seasonal Cycles Atlantic
Cumulative Distribution of Storm Lifetime Peak Wind Speed, with Sample of 1755Synthetic Tracks 95% confidence bounds
3000 Tracks within 100 km of Miami 95% confidence bounds
Captures effects of regional climate phenomena (e.g. ENSO, AMM)
Year by Year Comparison with Best Track and with Knutson et al., 2007
Couple to Storm Surge Model (SLOSH) Courtesy of Ning Lin, Princeton University
Histogram of the SLOSH-model simulated (primary) storm surge at the Battery for 7555 synthetic tracks that pass within 200 km of the Battery site.
Now Use Daily Output from IPCC Models to Derive Wind Statistics, Thermodynamic State Needed by Synthetic Track Technique
Compare two simulations each from 7 IPCC models: 1.Last 20 years of 20th century simulations2. Years 2180-2200 of IPCC Scenario A1b (CO2 stabilized at 720 ppm)
IPCC Emissions Scenarios This study
Projected Warming: This study
Basin-Wide Percentage Change in Power Dissipation Different Climate Models
Economic Analysis of Impact of Climate Change on Tropical Cyclone Damages With Robert Mendelsohn Yale
Assessing the Impact of Climate Change • Measure how climate change affects future extreme events • Reflect any underlying changes in vulnerability in future periods • Estimate damage functions for each type of extreme event • Estimate future extreme events caused by climate change
Integrated Assessment Model Emissions Trajectory Climate Scenario Event Risks Vulnerability Projection Damage Function Damage Estimate
Climate Models • CNRM (France) • ECHAM (Germany) • GFDL (U.S.) • MIROC (Japan; tropical cyclones only)
Baseline Changes in Tropical Cyclone Damage (due to population and income, holding climate fixed) • Current Global Damages: $13.9 billion/yr • Future Global Damages: 30.6 billion/yr • Current Global Deaths: 18,918/yr • Future Global Deaths: 7,168/yr
Examples of Modeling Output Current and Future Probability Density of U.S. Damages, MIROC Model Current and Future Damage Probability, MIROC Model