Download
1 / 20
200 likes | 331 Views
Analysis of CO in the tropical troposphere using Aura satellite data and the GEOS-Chem model: insights into transport characteristics of the GEOS meteorological products. Junhua Liu 1 , Jennifer A. Logan 1 , D. B. A. Jones 2 , N. J. Livesey 3 , I. Megretskaia 1 , C. Carouge 1 , P. Nedelec 4

E N D
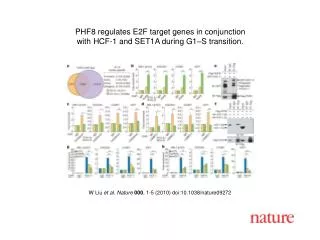
Analysis of CO in the tropical troposphere using Aura satellite data and the GEOS-Chem model: insights into transport characteristics of the GEOS meteorological products Junhua Liu1, Jennifer A. Logan1, D. B. A. Jones2,N. J. Livesey3, I. Megretskaia1, C. Carouge1,P. Nedelec4 School of Engineering and Applied Sciences, Harvard University, Cambridge, Massachusetts, USA Department of Physics, University of Toronto, Toronto, Ontario, Canada Jet Propulsion Laboratory, Pasadena, CA, USA CNRS-Laboratoired'Aerologie, France Sep 27th 2010, Aura Science Meeting Thanks to the MLS and TES Science teams J. Liu et al. ACPD 10, 19631, 2010
Outlook • Objective: • To understand processes affecting tropical tropospheric CO • To evaluate the effect of different vertical mixing in GEOS-4 and GEOS-5 on model performance • To identify possible causes for the discrepancies between model simulations and observations. • Tools: • Chemistry-transport Model • GEOS-Chem full chemistry model driven by GEOS-4 and GEOS-5 • Tagged CO simulation • Satellite data • LT: TES • UT: MLS
Biomass burning emissions (GFED v2 emissions) Jul - Oct Nov - Feb • South America: • Drier in 2005 (La Nina), CO emissions are twice those in 2006. • Fires start about one month later than southern Africa. • Southern Africa and northern Africa • Relatively smaller interannual variation, with slightly higher emissions in 2005
TES and GEOS-Chem CO at 681 hPa, 2005 Aug 05 Sep 05 Oct 05 Nov 05 Dec 05 Similar CO spatial pattern for model results with GEOS-5
MLS and GEOS-Chem CO at 215 hPa, 2005 Max. in E. Pacific in models especially in GEOS4, but not in MLS. Aug 05 Sep 05 Oct 05 Nov 05 Dec 05 MLS has highest CO in October. GEOS-4 max. in Nov GEOS-5 max. in Nov-Dec
South America - Seasonality and interannual variation Oct Nov MLS correction: • 146 hPa: x 0.7 & 215 hPa: x 0.5 215 hPa & 146 hPa: 2005: GEOS-4 ~1 month delay GEOS-5 1-2 month delay 2006: both model peaks are too broad and too late Nov Oct 681 hPa & 422 hPa: GEOS-4: matches data GEOS-5: peak too broad, lower than GEOS4 Optical bench warm-up of TES CO DATA GEOS-4 GEOS-4 with AK GEOS-5 GEOS-5 with AK
GEOS-5 South America - Dynamic influence 226 hPa Vertical Mass Flux (Pa/s) Contours: Air mass flux (upward only, Pa/s): left and middle: [0.12,0.05] Pa/s, right: [0.06,0.03] Pa/s. Color: CO (ppbv). GEOS-4 The lag in GEOS-5 is greater because 1) the convection moves southward later than in GEOS-4 , and 2) the convection decays at a lower altitude.
South America – Source contributions Nov 215 hPa & 139 hPa: • More CO from isoprene – causing the CO peak to stay high in Nov. • CO from local fires peaks in Oct at 215 hPa, in Nov at 139 hPa. Sep Oct • 430 hPa • In N. winter, CO influenced by N. Africa fires. Sep N. Afr CO from fires in: S. America S. Africa N. Africa Indonesia Isoprene Sep • 688 hPa • More CO from local fires in 2005 Fires Sep
South America The UT CO maximum is too late in the models compared with MLS, because: • Deep convection decays at too low an altitude, especially in Oct, when the wet season starts. The lag in GEOS-5 is greater because the convection moves southward later than in GEOS-4 , and the convection decays at a lower altitude. • The source of CO from isoprene in the model is too large during the wet season.
Southern Africa - Seasonality and interannual variation DATA GEOS-4 GEOS-4 with AK GEOS-5 GEOS-5 with AK • Model and observations: • Phase matches from 681 to 146 hPa well – reflecting reasonable meteorological patterns and less influence from isoprene. • Modeled CO lower than the observations – toolow surface emissions in the model. silk • CO temporal patterns: • Small IAV in the UT. • 2nd maximum in the winter – North Africa fire. • A time lag of the peak in fire counts (Jul, Aug) and CO loading (Sep, Oct) – seasonal change of meteorological pattern. South America Isoprene is a smaller source of CO over Africa. Africa
Southern Africa - Sensitivity test with increase emission Red: original run Blue: run with increased fire emissions Increased the CO emissions by ~70% in S. America and by ~100% in S. Africa from Jun. to Oct. in the model (Kopacz et al. 2010). • Better agreement with the magnitude of observed CO in July to October in LT, MT. • CO is too high in UT. • Difficult to match CO in the LT and UT in GEOS-4 – possible overly vigorous vertical transport.
Northern Africa - Seasonality and interannual variation DATA GEOS-4 GEOS-4 with AK GEOS-5 GEOS-5 with AK Too much CO is lofted to the UT as indicated by MLS data – verified by Mozaic data N. Afr S. Afr
Transport of CO to the UT in GEOS-4, Feb. 2005 Too much CO is lofted to the UT Too strong Harmattan Winds ? or too strong convection? CO is lofted in the ITCZ Anticyclone over the source region – preventing vertical mixing Harmattan winds transport CO from fires to Gulf of Guinea
South America: equatorial easterlies may be too strong in Aug/Sept convection in October detrains at too low an altitude, particularly in GEOS-5 isoprene is too large a source of CO, causing CO max. to occur too late in model South Africa: GEOS-4: Possible overly vigorous vertical transport early in the wet season. GEOS-5: Vertical transport may be more realistic than that in GEOS-4 North Africa Harmattan winds too strong? Possible excessive lofting in ITCZ These transport problems will impact inversion studies, which cannot account for biases in transport. Conclusion
South America - Sensitivity test with increased emission Red: original GEOS-4 run Blue: run with increased fire emissions Increased the CO emissions by ~70% in S. America and by ~100% in S. Africa from Jun. to Oct. in the model (Kopacz et al. 2010). • UT: • The CO peak is earlier • The timing discrepancy of the seasonal maximum remains. • LT: • CO is too high compared with TES.