Download
1 / 9
90 likes | 105 Views
This study focuses on the Lightning Potential Index (LPI) as a measure of charge separation leading to lightning flashes in convective thunderstorms. It explains the calculation of LPI based on model-simulated updraft and microphysical fields within the charge separation region. The paper also discusses the threats associated with different LPI values, as well as the Layer Mean Relative Humidity (LAYRH) and Supercell Composite Parameter (SCP).

E N D
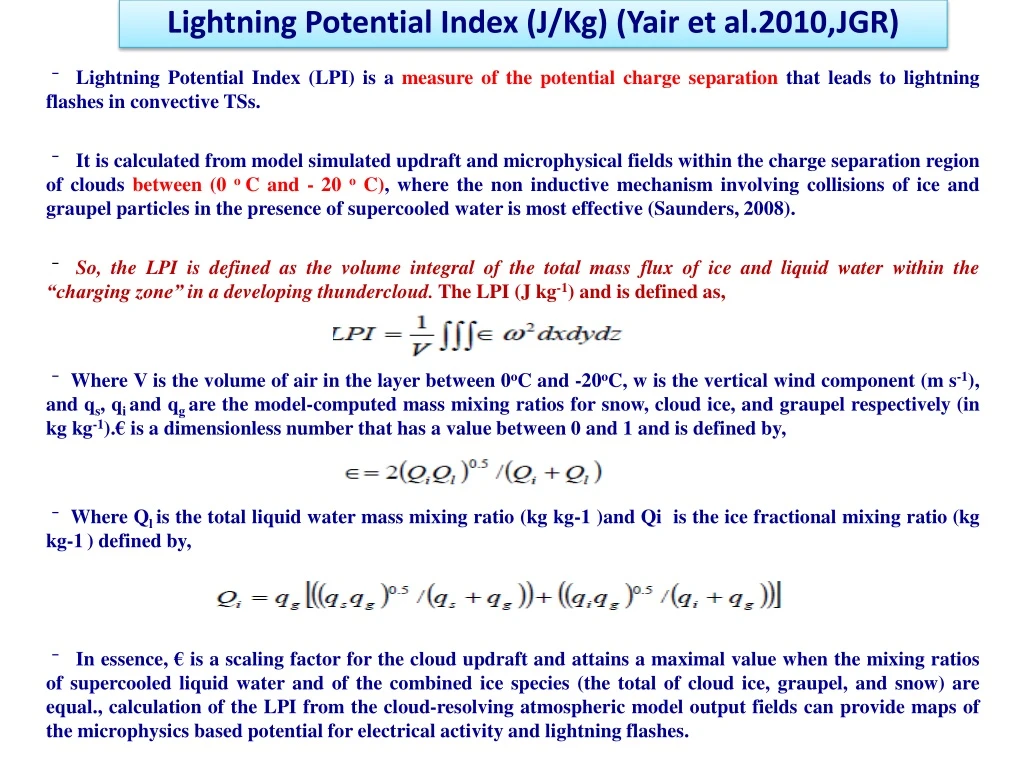
Lightning Potential Index (J/Kg) (Yair et al.2010,JGR) • Lightning Potential Index (LPI) is a measure of the potential charge separation that leads to lightning flashes in convective TSs. • It is calculated from model simulated updraft and microphysical fields within the charge separation region of clouds between (0 o C and - 20 o C), where the non inductive mechanism involving collisions of ice and graupel particles in the presence of supercooled water is most effective (Saunders, 2008). • So, the LPI is defined as the volume integral of the total mass flux of ice and liquid water within the “charging zone” in a developing thundercloud. The LPI (J kg-1) and is defined as, • Where V is the volume of air in the layer between 0oC and -20oC, w is the vertical wind component (m s-1), and qs, qiand qgare the model-computed mass mixing ratios for snow, cloud ice, and graupel respectively (in kg kg-1).€ is a dimensionless number that has a value between 0 and 1 and is defined by, • Where Qlis the total liquid water mass mixing ratio (kg kg-1 )and Qi is the ice fractional mixing ratio (kg kg-1) defined by, • In essence, € is a scaling factor for the cloud updraft and attains a maximal value when the mixing ratios of supercooled liquid water and of the combined ice species (the total of cloud ice, graupel, and snow) are equal., calculation of the LPI from the cloud-resolving atmospheric model output fields can provide maps of the microphysics based potential for electrical activity and lightning flashes.
IC:2019073000 Day1
Day2 IC:2019073000
IC: 2019073000 Hourly evolution of IMD: WRF (3km) Derived :Lightning Potential Index (J/kg)
IC: 2019073000 Hourly evolution of IMD: WRF (3km) Derived :Threat of Lightning Potential Index (J/kg) Threat Level : LOW: LPI < 0.001 and >0.0005 Threat Level : Moderate: LPI :< 0.01 and > 0.001 Threat Level : High : LPI > 0.01
IC: 2019073000 Hourly evolution of IMD: WRF (3km) Derived : Supercell Composite Parameter SCP = (CAPE/1000 J kg–1) × (SRH/50 m–2 s–2) × (BWD/20 m s–1) Where -- CAPE 0–180-hPa-layer “most unstable” 0-3km SRH Storm Relative Helicity between 0-3km BWD Bulk shear is computed from the uand υ winds between the model’s 0–30-hPa-above-ground layer and 500 hPa. SCP >= 1 are associated with environments conducive to thunderstorm updraft persistence and rotation. ( Ref: Carbin et al. 2015 BAMS Threat Level : LOW: 3 < SCP < 5 Moderate:5 < SCP < 7 High : SCP > 7
IC: 2019073000 Hourly evolution of IMD: WRF (3km) Derived :Layer Mean Relative Humidity LAYRH= Layer mean Relative Humidity Between 1000hPa and 100hPa( Ref: Rajeevan et al. 2012 J. Earth Sys. Sci) Threat Level : LOW: 20 < LAYRH < 40 Moderate: 40 < LAYRH < 60 High : LAYRH > 60