Download
1 / 21
210 likes | 326 Views
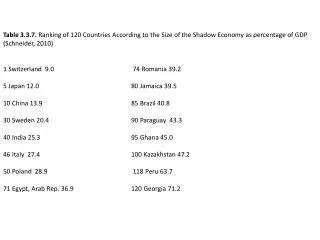
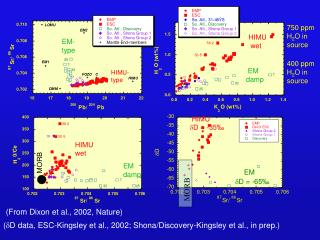
International Network. From Feely et al (2010). Diversity of Calcifiers. Ocean Acidification Becomes Warming ’ s ‘ Evil Twin ’ at COP15. Photos: Scripps Oceanography. CO 2 and pH “ time series ” data from North Pacific Ocean. From R. Feely & D. Keeling. Ocean Acidification.

E N D
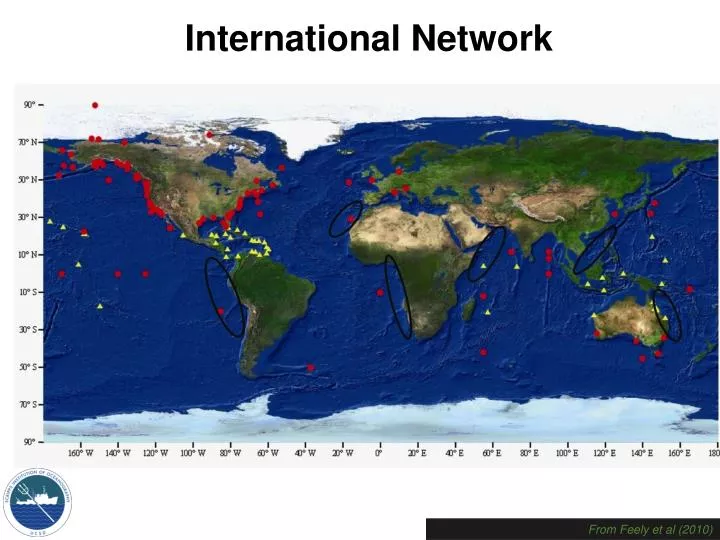
International Network From Feely et al (2010)
Ocean Acidification Becomes Warming’s ‘Evil Twin’ at COP15 Photos: Scripps Oceanography
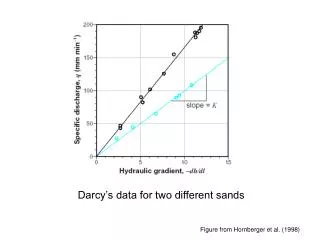
CO2 and pH “time series” datafrom North Pacific Ocean From R. Feely & D. Keeling
Ocean Acidification • Since about 1850, the CO2 chemistry of the oceans has been changing because of the uptake of anthropogenic CO2 by the oceans. • Decrease in pH of about 0.1 over the last two centuries; a projected decrease of 0.4 by 2100 • Today’s ocean has undergone a 30% increase in acidity and a decrease in carbonate ion concentration of about 20% • These changes in pH and carbonate chemistry may have profound impacts on many open ocean and coastal marine ecosystems. Photo: Missouri Botanical Gardens http://www.biol.tsukuba.ac.jp/~inouye Coral Calcareous Plankton
pH CO32- CO2(aq) Brewer (1997) CO2-induced seawater acidification: Simple chemistry Skirrow & Whitfield (1975) Wolf-Gladrow, Riebesell, Burkhardt, Bijma (1999)
Calcification/carbonatedissolution Saturation State [ ] [ ] + - 2 2 Ca CO W 3 = phase * K sp , phase W > = 1 precipitation W = = 1 equilibrium W < = 1 dissolution Ca2+ + CO32- CaCO3 Ω>1 Ca2+ + CO32- CaCO3 Ω<1
A Path Forward • We know enough to act: reduce CO2 • To know precisely which commercial fisheries (& marine ecosystems) will be affected first… • International measurement network: CO2 as function of time and depth, available for all • Corals • high latitudes, coastal, & open ocean • Communal facilities for live organism studies • Integrated Modeling “from CO2 to fish”
An International Network From Feely et al (2010)
‘Baja to BC” Test bed • The groups already cooperate • “Baja to BC” West Coast is one example which urgently needs ocean acidification observing system • CO2 observations will tell us where & when to look for biological effects • Community experimental facility to test impacts on commercially & ecologically important species
In-Situ Measurements from Fixed Moorings Images: Uwe Send
The power of CCE1/2 comes from the context of other measurements California Current Ecosystem (CCE) moorings - Ships sample many variables and provide ground truth - Gliders provide cross-shelf sampling with a few variables - Moorings give full time sampling, wide range of variables CCE-2(SIO/SWFSC/PMEL) CCE-1(SIO/SWFSC/PMEL) CalCOFI/ LTER Pt.Conception Chlorophyllshown on surface;salinity on cross-section Gliders(CORC, LTER, Moore) CalCOFI line 80
Question: Why do we think we can create a regional then global network?Answer: The oceanographic community has already built a network of 3000+ robots for temperature and salinity over last 12 years: Argo
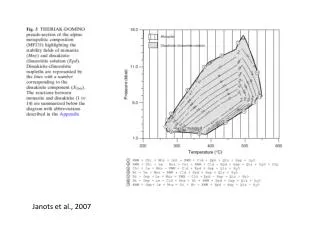
Robot Positions 03 Dec 2010 26 nations contribute; data available to all www.argo.ucsd.edu
ROBOTS Depth Temperature Salinity Need to be Extended to Dissolved Gasses & biology Argo Floats Davis and Roemmich with a float “robot” A profiling Argo float
Ocean Temperature Increase: measured 0-700m NAtl SAtl Red=Observed Blue=Model average SPac NPac NInd Sind 1940 2000
A Lesson from Argo • One proven route to an operational International network • 1. Scientists do it first • 2. Collect the data to “make the case” • 3. Agencies and formal structures use that case to complete the network & make it “sustained” • 4. “Light touch” open network structure survives the transition (much to the delight of scientists..)