Download
1 / 32
330 likes | 516 Views
The Watershed Treatment Model. Chesapeake Bay Science and Technical Advisory Committee (STAC) Annapolis, MD June 7, 2011. Deb Caraco Center for Watershed Protection dsc@cwp.org www.cwp.org. About the Center for Watershed Protection. Non-profit 501(c)3, non-advocacy organization

E N D
The Watershed Treatment Model Chesapeake Bay Science and Technical Advisory Committee (STAC) Annapolis, MD June 7, 2011 Deb Caraco Center for Watershed Protection dsc@cwp.org www.cwp.org
About the Center for Watershed Protection Non-profit 501(c)3, non-advocacy organization Work with watershed groups, local, state, and federal governments Provide tools communities need to protect streams, lakes, and rivers Over 20 staff in MD, VA, NY www.cwp.org www.awsps.org
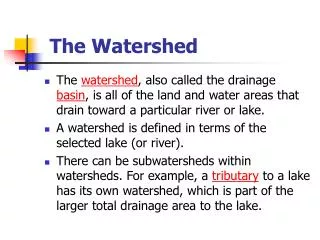
Overview • Description of the Watershed Treatment Model • Model Overview • Some Details • Recent Updates • Integration of Local Watershed Planning Tools into the Chesapeake Bay Program
What is the WTM? • A simple, spreadsheet model for the rapid assessment of watershed treatment options • Annual output • Pollutant loads (lbs/acre) • Bacteria Loads (MPN/yr) • Runoff Volume (acre-ft/yr)
WTM Applications • Stormwater Program Assessment • Stormwater Retrofit Ranking • Source Water Assessment • Determine Progress on Load Reductions* • TMDLs • MS4 Accounting
WTM Terminology • Primary Sources • Secondary Sources • Management Practices • Discount Factors W T M ABCs
Primary Sources • Determined entirely from land use/cover • Residential • Commercial • Industrial • Forest • Rural
Primary Sources: • Residential Land • Commercial Land • Roadways • Industrial Land • Forest • Active Construction • Open Water
Secondary Sources • Cannot be calculated solely by land use • Examples • CSOs, SSOs • Septic Systems • Channel Erosion
Types of Management Practices • Structural: • ponds, swale, LID etc. • Non-Structural: • street sweeping, downspout disconnect, buffers • Programmatic: • lawn and pet waste education, etc
Discount Factors • Ideal load reductions can rarely be achieved • Lack of space • Imperfect practice application • Inability of programs to be completely effective • Discount factors "discount" load reductions to account for less than perfect application of practices.
A Few WTM Details • Model Structure • Some Data Entry Tips and Rules • Ongoing WTM Updates The (Tasmanian) Devil’s in the Details
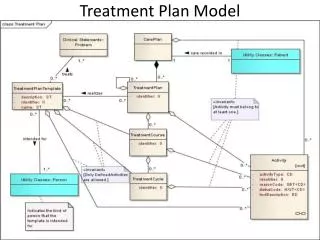
<?xml version="1.0"?><AllQuestions /> <?xml version="1.0"?><AllResponses /> <?xml version="1.0"?><Settings><answerBulletFormat>Numeric</answerBulletFormat><answerNowAutoInsert>No</answerNowAutoInsert><answerNowStyle>Explosion</answerNowStyle><answerNowText>Answer Now</answerNowText><chartColors>Use PowerPoint Color Scheme</chartColors><chartType>Horizontal</chartType><correctAnswerIndicator>Checkmark</correctAnswerIndicator><countdownAutoInsert>No</countdownAutoInsert><countdownSeconds>10</countdownSeconds><countdownSound>TicToc.wav</countdownSound><countdownStyle>Box</countdownStyle><gridAutoInsert>No</gridAutoInsert><gridFillStyle>Answered</gridFillStyle><gridFillColor>255,255,0</gridFillColor><gridOpacity>50%</gridOpacity><gridTextStyle>Keypad #</gridTextStyle><inputSource>Response Devices</inputSource><multipleResponseDivisor># of Responses</multipleResponseDivisor><participantsLeaderBoard>5</participantsLeaderBoard><percentageDecimalPlaces>0</percentageDecimalPlaces><responseCounterAutoInsert>No</responseCounterAutoInsert><responseCounterStyle>Oval</responseCounterStyle><responseCounterDisplayValue># of Votes Received</responseCounterDisplayValue><insertObjectUsingColor>Red</insertObjectUsingColor><showResults>Yes</showResults><teamColors>Use PowerPoint Color Scheme</teamColors><teamIdentificationType>None</teamIdentificationType><teamScoringType>Voting pads only</teamScoringType><teamScoringDecimalPlaces>1</teamScoringDecimalPlaces><teamIdentificationItem></teamIdentificationItem><teamsLeaderBoard>5</teamsLeaderBoard><teamName1></teamName1><teamName2></teamName2><teamName3></teamName3><teamName4></teamName4><teamName5></teamName5><teamName6></teamName6><teamName7></teamName7><teamName8></teamName8><teamName9></teamName9><teamName10></teamName10><showControlBar>All Slides</showControlBar><defaultCorrectPointValue>0</defaultCorrectPointValue><defaultIncorrectPointValue>0</defaultIncorrectPointValue><chartColor1>187,224,227</chartColor1><chartColor2>51,51,153</chartColor2><chartColor3>0,153,153</chartColor3><chartColor4>153,204,0</chartColor4><chartColor5>128,128,128</chartColor5><chartColor6>0,0,0</chartColor6><chartColor7>0,102,204</chartColor7><chartColor8>204,204,255</chartColor8><chartColor9>255,0,0</chartColor9><chartColor10>255,255,0</chartColor10><teamColor1>187,224,227</teamColor1><teamColor2>51,51,153</teamColor2><teamColor3>0,153,153</teamColor3><teamColor4>153,204,0</teamColor4><teamColor5>128,128,128</teamColor5><teamColor6>0,0,0</teamColor6><teamColor7>0,102,204</teamColor7><teamColor8>204,204,255</teamColor8><teamColor9>255,0,0</teamColor9><teamColor10>255,255,0</teamColor10><displayAnswerImagesDuringVote>Yes</displayAnswerImagesDuringVote><displayAnswerImagesWithResponses>Yes</displayAnswerImagesWithResponses><displayAnswerTextDuringVote>Yes</displayAnswerTextDuringVote><displayAnswerTextWithResponses>Yes</displayAnswerTextWithResponses><questionSlideID></questionSlideID><controlBarState>Expanded</controlBarState><isGridColorKnownColor>True</isGridColorKnownColor><gridColorName>Yellow</gridColorName></Settings> <?xml version="1.0"?><AllAnswers /> Step 1. Calculate Existing Pollutant Loads Primary Sources Secondary Sources Existing Management Practices Existing Loads - = + Step 2. Apply “Future” Management Practices Future Management Practices Loads with Future Management Practices Existing Loads = - Retrofit Worksheet Stream Restoration Worksheet Step 3. Account for Future Growth Loads with Future Management Practices New Development + = Loads with Future Growth Future Land Use
Step 1: 1a. Primary Sources 1b. Secondary Sources 1c. Existing Management Practices 1d. Existing Loads] Step 2: 2a. Future Management Practices 2b. Retrofit Worksheet 2c. Stream Restoration Worksheet 2d. Load with Future Management Practices Step 3: 3a. Future Land Use 3b. New Development 3c. Loads With Future Growth Spreadsheet “Tabs”
Use Local Data if Available Data Entry: The WTM is Color-Coded. Green (Cells and Tabs) require user input Blue Cells are defaults the user can override Grey Cells should not be modified Purple (Cells and Tabs) represent Final Outputs
Some Recent Updates • Additions to the model. • Some sources simplified • Additional research to update some sources and practices.
Example Addition: Runoff Reduction • Incorporate runoff coefficients for various soil-land use combinations. • Assign Runoff Reduction to various practices
Example Simplification: Channel Erosion • Problem: • Original WTM asked for data that we found was not readily available • Alternative was too simplified. • Solution: • Offer alternatives to the user. • Allow use of other outside methods
New Research/Update: Turf Management • Original Version: • Focuses “leachate” only. • Relies on a few studies. • Asks for some data that is not readily available. • New Version: • Is backed by an extensive literature survey • Incorporates field observations from watershed assessments.
Key Considerations for Integrating Local Watershed Planning Where does Local Modeling Fit in? Source: MAST Maryland’s Assessment and Scenario Tool, (MDE, MD DNR, MDP) http://archive.chesapeakebay.net/pubs/calendar/47043_05-09-11_Presentation_1_11266.pdf
Bay Program Needs • List of practices for the Chesapeake Bay Watershed Model (the Bay Model) from local planning efforts. • Local governments need an estimate of the “credit” given in the Bay Model. • MAST, other tools help estimate this aggregation of practices.
Some Concerns About Using “Local” Models (e.g., WTM) • The numbers may or may not line up with Bay Program assumptions. • Is the model “Bay Program Sanctioned” • What if the model includes practices that aren’t in the Bay Model? • Do the land use types line up with the Bay Model?
How much N and P did you say you got? Do the Numbers Line Up? • Some key concerns • Are the assumed efficiencies the same? • Are the loading rates the same? • Do they need to be?
WTM: Issues of Consistency • Efficiencies of most practices are similar to Bay Program data (but account for “filtering” versus “runoff reduction” rather than an aggregate). • Slightly different mechanism of calculating loading rates from some sources.
To Ensure Consistency with the CBP Model • Ensure that basic data (e.g., loading rates and efficiencies) are the same. • Update WTM (or other local model) as Bay Program assumptions are updated.
What do other local models offer? • Other pollutants (beyond TN, TP, TSS) • Broader range of practices* • Assessment of the degree of implementation (e.g., “discount factors”) • Ability to predict benefits of educational, other practices.
Can Local Efforts Identify New Practices? • Example: Illicit Discharge Removal • Currently not accounted for in the Bay Model. • Local modeling efforts identify the potential removal. • Use monitoring data to actually measure pollutant removal.
Can Local Models Quantify “Reasonable Assurances” • Some key assurances: • Long term maintenance. • Proper practice sizing and implementation. • Can we use the discount factors concept to quantify this? • If so, how do we do this in a consistent manner?
What About Educational/ Programmatic Practices? • We encourage and require education and public education/ participation. • How do we account for the actual results of the program? • Local Models can predict the benefits based on assumed effectiveness. • What follow-up is needed to ensure that the benefits are actually achieved?
Summary • The Watershed Treatment Model (WTM) is a simple, spreadsheet-based model that accounts for a wide range of practices. • Some details need to be worked out for any local model to be consistent with the Bay Watershed Model. • Local models can potentially inform the way practices are modeled in the Bay Watershed.
Questions? Deb Caraco Center for Watershed Protection 607-277-6337 dsc@cwp.org www.cwp.org www.awsps.com