Download
1 / 26
260 likes | 425 Views
The First Full Calibration of the Phase 5 Watershed Model. Modeling Subcommittee 10/17/2006. Today’s Presentations. This Presentation Quick phase 5 overview Setup for the rest of the day’s presentations Rob Method of calculating calibration targets for land uses Jing

E N D
The First Full Calibrationof thePhase 5 Watershed Model Modeling Subcommittee 10/17/2006
Today’s Presentations • This Presentation • Quick phase 5 overview • Setup for the rest of the day’s presentations • Rob • Method of calculating calibration targets for land uses • Jing • Method and results of land nutrient calibration • Me • Method and results of river WQ calibration • Rob • Phase 5 input and output visualization and summary tool (“the vortex”)
Collaborators – Chesapeake Bay Program • Lewis Linker – EPA – modeling coordinator • Gary Shenk – EPA – lead for phase 5 development • Jing Wu – University of Maryland – watershed modeler • Rob Burgholzer – University of Maryland – Nutrient data analyst • Kate Hopkins – University of Maryland - GIS analyst • Jeff Sweeney – University of Maryland – Nutrient data analyst • Peter Claggett – USGS – Land data manager • Sara Brandt – Chesapeake Research Consortium Fellow • Jim Hart – Chesapeake Research Consortium Fellow • Russ Mader – NRCS – Nutrient Coordinator • Kelly Shenk – EPA – Nutrient Coordinator • Ping Wang – Forest simulation • Steve Preston – USGS – Monitoring coordinator • STAC - review • Many, many people who participate in data gathering
Collaborators – US Geological Survey • Maryland Office • Jeff Raffensperger – Project coordinator • Sarah Martucci – GIS analyst • Joe Vrabel – software engineer • Angelica Gutierrez – optimization specialist • Gary Fisher – precipitation data collection • Virginia Office • Doug Moyer – Project coordinator • Alan Simpson – river and reservoir morphology • Jen Krstolic – GIS analyst • Jeff Keaton – Model calibration • Jason Pope – Model calibration • Pennsylvania Office • Mike Langland – Water quality data • National • Lauren Hay – Precipitation Model
Collaborators – State Agencies • State Governments Supplying Data • NY, PA, MD, DE, WV, VA, and DC • State Governments Supplying Funding • MD and VA
Collaborators – Other • Penn State – • Jim Lynch and Jeff Grimm • Atmospheric Deposition model • Scott Sheeder, Barry Evans and Egide Louis • Urban load model • Interstate Commission for the Potomac River Basin • Ross Mandel – project coordinator • Julie Kiang – hydrologic model calibration support
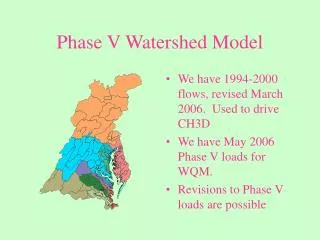
Increase in Segmentation to get meaningful output at the trib strategy level and below
Land Use Acreage BMPs Fertilizer Manure Atmospheric Deposition Point Sources Septic Loads Rainfall Temperature Evapotranspiration Wind Solar Radiation Dewpoint Cloud Cover Better input data for accuracy
WDM = HSPF-specific binary file type UCI = User Controlled Input (input file) Model Software Structure Better SoftwarePossible to run modelEase of scenario implementationIncreased accuracy MET WDM ATDEP WDM PS WDM Land Input File Generator River Input File Generator 4 1 External Transfer Module 2 3 5 Land variable WDM River variable WDM Final Text Output 6
Model Structure • Files External Transfer Module 3 Automated Calibration • Makes Calibration Feasible • Ensures even treatment across jurisdictions • Enables uncertainty analysis • Fully documented calibration strategy • Repeatable
Community Model • Entire model available on web • Input data • HSPF • Phase 5 system • Already in Use • Community model in Climate Change Study • Community model at ICPRB • Phase 5 output in Potomac PCB TMDL • Phase 5 information in MDE TMDLs • Phase 5 information in USGS Watershed Study
Today’s Presentations • This Presentation • Quick phase 5 overview • Setup for the rest of the day’s presentations • Rob • Method of calculating calibration targets for land uses • Jing • Method and results of land nutrient calibration • Me • Method and results of river WQ calibration • Rob • Phase 5 input and output visualization and summary tool (“the vortex”)
Land Calibration – 2 types • AGCHEM – • Mass Balance / Reaction Rate Based Mechanistic Simulation • Responsive to inputs and uptake • PQUAL • Empirical, coefficient-based simulation • Sensitive to hydrology and sediment only
Export Export Export Export Export Export Export AGCHEM simulation After HSPF documentation Trees Denitrification Roots Leaves Nitrate Atmospheric Deposition Particulate Particulate Solution Labile Refractory Ammonia Organic N Organic N Solution Solution Adsorbed Labile Refractory Ammonia Organic N Organic N
PQUAL / IQUAL Simulation NH3 = flow * conc + sed * factor SURFACE INTERFLOW NH3 = flow * conc Groundwater NH3 = flow * conc
Automated Calibration ofAGCHEM Land Uses • First Calibration of this type of HSPF • First long-term AGCHEM calibration with full simulation of nutrient storages • Scope • 308 land segments • 12 AGCHEM land uses • (+ 6 nutrient management) • 8 load endpoints • = 29568 Targets • Calibrating at 10 land uses per day, This would take a year with no weekends or vacation
Automated Calibration ofPQUAL Land Uses • Not aware of this type of calibration but probably has predecessors • Scope • 308 land segments • 7 PQUAL / IQUAL land uses • 8 load endpoints • = 17248 Targets • Possible to calibrate to all targets in a single day
Automated River Calibration • First Calibration of this type of HSPF • Scope • 100 river calibration stations • 8 concentration endpoints • 800 Targets • Calibrating at 2 stations per day, This would take two months with no weekends or vacation
Automated Calibration • Makes Calibration Feasible • Ensures even treatment across jurisdictions • Enables uncertainty analysis • Fully documented calibration strategy • Repeatable
Status for Today • Calibration methodsare good, but still some improvements available • River calibration oscillation. • Forest stability over time. • River TOC method not implemented • Calibration dataare close to final, but some improvements available • Error in TP Target • New land use consistent with FIA and urban modeling? • TN:TP balance
Schedule • Today – First overall calibration. Methodology close to final • Nov 14 – Scoping Scenarios presented to Water Quality Steering Committee • January 2007 – Calibration Update • April 2007 – Calibration Update • July 2007 – Final Calibration • January 2008 – Approved for management use
Today’s Presentations • Rob • Method of calculating calibration targets for land uses • Jing • Method and results of land nutrient calibration • Me • Method and results of river WQ calibration • Rob • Phase 5 input and output visualization and summary tool (“the vortex”)