Download
1 / 17
170 likes | 376 Views
Antarctic Ice Core Results to Date. Amanda Solomon Geology 495 February 15, 2006. Outline. Introduction What is an ice core? Why study ice cores? Previous Studies Antarctic Ice Core Results Vostok Dome C Conclusions. Introduction. What is an ice core?

E N D
Antarctic Ice Core Results to Date Amanda Solomon Geology 495 February 15, 2006
Outline • Introduction • What is an ice core? • Why study ice cores? • Previous Studies • Antarctic Ice Core Results • Vostok • Dome C • Conclusions
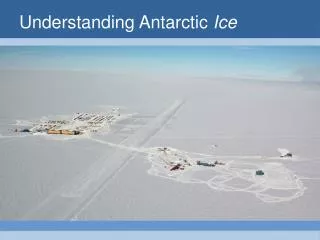
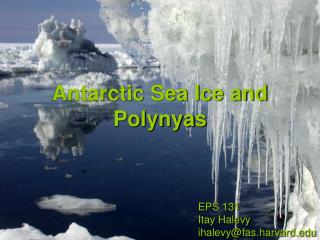
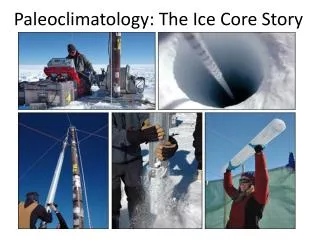
Introduction • What is an ice core? • Similar to other core samples, but made of ice not rock. http://www.homepage.montana.edu/~lkbonney/IMAGES/Antarctic images/Ice Microbes/Ice core.JPG Photo credit: Chelsey Ebel
Introduction • Why study ice cores? • Provide useful climatic data • Layers of snow and ice • Debris such as ash and dust • Temperature from MSA and NSSS • Ocean Volume from 18O/16O isotopes • Composition of the atm. from inclusions • Mean accumulation rate from Deuterium isotopes http://earthobservatory.nasa.gov/Library/UVB/Images/antarctica.jpg
Tison, J. L. et. al., 1993 • Used ice core samples to study D/18O & K/Mg isotope ratios • Did a crystallographic and structural study of the ice core • Reconstructed the salinity of the host H2O & developed a model for marine ice accretion
Warwick, F. et. al., 1994 • Looked at ice cores taken by Mayewski & Legrande (1990) which showed a near-surface increase of nitrate concentration • Took new surficial samples and analysed them to conclude that the nitrate ppt was stratospheric i.e. snow
deMora, S. J. et. al., 1997 • Took samples from aerosols, surficial snow, and ice cores • Studied the methanesulphonate (MSA) & non-sea salt sulphate (NSSS) for changes in the dimethylsulphide (DMS) derived species • DMS from oceans enters atm. and oxidizes to form MSA & NSSS • Forms clouds in the marine trophosphere which affects the earth’s albedo and causes a cooling effect • Found that the aerosols were consistent with transport from the mid-latitudes
Jeffries, M., et. al., 1997 • Studied ice core and stable isotope data • Ice core data showed a trend of an upper granular ice layer and a lower columnar ice layer • 18O Stable isotope data showed the difference between snow ice and frazil ice • Obtained the first understanding of the main physical characteristics, conditions and processes in a first year ice pack. • Ice growth occurs in stages of frazil ice growth and pancake ice formation, followed by thermodynamic thickening
Seigert, M., et. al., 2001 • Used airborne radar data to map the 3D structure of the ice sheet around Dome C • Studied data to determine the past and present flow of ice • Determined that above 2km the ice layers “submerge and diverge from each other in vertical section” as a result of accumulation. • Below 2km, ice layers are controlled by subglacial topography and former ice flow
Narcisi, B., et. al., 2001 • Studied layer of Tephra (particles few to 200 micrometers) in ice core from Talus Dome • NSSS data allowed dating of layer to 1254 +/- 2 a A.D. • Determined area ash covered, looked at prevailing wind directions, and compared composition of nearby volcanoes to the ash sample • Concluded that nearby volcanoes The Pleiades or Mt. Rittmann were responsible
Orelemans, J., 2005 • Used deuterium record from EPICA Dome C to determine mean accumulation rate, and the composite deep sea 18O record to determine the total ice volume on earth • Used this data in a simple ice sheet model to determine the volume history of the Antarctic Ice Sheet
Antarctic Ice Core Results Map of Antarctica showing main study areas. From DeMora et. al., 1997.
Vostok • Shows evidence of 4 past glaciations • Analyzed to determine a history of atmospheric CO2, temperature, and the composition of wind blown dust • Can be correlated with the upper part of the EPICA Dome C ice core http://www.ldeo.columbia.edu/~mstuding/new_vostok_cartoon_high.gif
Dome C • Drilled to a depth of 3270.2m • Oldest ice at depth is around 720 000 a • Shows evidence of eight past glaciations • Spot was picked using radar data so that ice layers are horizontal.
http://upload.wikimedia.org/wikipedia/en/f/f2/Epica_do18_plot.pnghttp://upload.wikimedia.org/wikipedia/en/f/f2/Epica_do18_plot.png Comparision of the Vostok and EPICA (Dome C) ice cores.
Further Study Why is further study of Antarctica important? -large area (~14 million km2) - 98% covered in ice - desert environment - stable for many years = virtually pristine climate record that has been largely unstudied
Conclusions • Ice cores are a valuable tool to reconstruct the past environment, and can be applied in many different studies • Antarctica has been glaciated for many years, and has been largely untouched by human civilization or biogenic activity • Ice cores that have been studied give climate data going back 720 000 years, and show evidence of at least 8 glaciations • Ice cores have correlated across fairly large areas and can be correlated to previous marine isotope data