Download
1 / 49
490 likes | 582 Views
ECOLOGY of the ANTARCTIC SEA ICE ZONE EASIZ. WATER COLUMN PROCESSES Comparative Plankton Ecology. Hugh Ducklow & Robert Daniels College of William & Mary Ray Smith, Maria Vernet, Dave Karl, Doug Martinson Sharon Stammerjohn, Robin Ross, Langdon Quetin, Bill Fraser, Karen Baker, Andy Clarke

E N D
WATER COLUMN PROCESSES Comparative Plankton Ecology Hugh Ducklow & Robert Daniels College of William & Mary Ray Smith, Maria Vernet, Dave Karl, Doug Martinson Sharon Stammerjohn, Robin Ross, Langdon Quetin, Bill Fraser, Karen Baker, Andy Clarke Palmer Antarctica LTER EASIZ Final Symposium Korcula, Croatia 27 September 2004
ANTARCTIC SEA ICE ZONE Productivity long-recognized Sir Alastir Hardy, Great Waters
QUESTIONS • HOW DO VARIATIONS IN SEA ICE EXTENT & DURATION INFLUENCE WATER COLUMN ECOLOGY & BIOGEOCHEMISTRY? • -- primary production & sedimentation in LTER study region along West Antarctic Peninsula • HOW DOES PHYTOPLANKTON COMMUNITY STRUCTURE INFLUENCE BIOGEOCHEMICAL PROCESSES? • -- structure of carbon exchanges in Ross Sea and WAP foodwebs. • 3. EMPHASIS ON LARGE-SCALE PROCESSES AND INTERANNUAL VARIATIONS
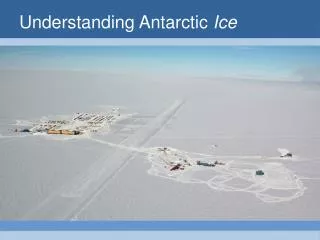
PALMER, ANTARCTICA Long Term Ecological Research Program (LTER) • Part of US LTER Network of 26 sites • 1991 – present • Regional (200,000 km2) and local sampling • Focus on sea ice dynamics, water column processes • and apex predators • Physics, remote sensing and ice, microbial biogeochemistry, • sedimentation, primary production, krill, penguins
Bathymetry PENGUIN COLONIES & FORAGING LOCATIONS
1. SEA ICE VARIABILITY AND WATER COLUM PROCESSES • Sea ice extent, duration and retreat • Primary production • Sedimentation – integrator of water column • processes – and link to benthos • Relationships among these processes
LTER Sampling Grid ~100 stations surface to bottom grid sampled every January, 1991-2004 LTER sample grid Palmer Station Sediment Trap
Measuring and characterizing sea ice: Sea Ice in Palmer LTER Study Area Extent (black lines): the area enclosed by the 15% sea ice concentration contour – includes open water in the SIZ. Area (red): the area covered by sea ice concentrations > 15% within the total extent. Open water (blue): Extent minus area. km2 month Solid lines: Observations Dotted lines: 1991-01 mean Data from NASA-GSFC SSMI-SSMR Time Series processed by Sharon Stammerjohn and Ray Smith for Palmer LTER
Palmer LTER Sea Ice Indices, 1991 - 2002 103164 107753 106750 96733 74213 99872 96765 84627 Coverage, km2 78005 69932 79780 153733 110297 month Mean extent given for each year. Total area 200,000 km2; max: 1980, 150,000, min: 1989, 42,000
DAY of ADVANCE DAY of RETREAT 1991-2001 mean at Trap: Day 190 1991-2001 mean at Trap: Day 310 Sea Ice Advance and retreat in LTER grid
Interannual anomalies in date of ice retreat (WAP) ICE RETREAT Mean: Day 310 1993: +10 1994: +20 1995: +25 1996: -05 1997: +20 1998: -25 1999: +10 2000: -05 2001: -05 Symbol in upper center of contour plots is location of sediment trap mooring at 64.5S, 66W
To describe interannual variability over the decade of sampling: Standardized anomaly = (Xi – X)/ X where X is annual mean over the decade. range –1 to +1 (0 = average) INTERANNUAL ANOMALIES
Sediment trap variability, 1993-2003 20 27 34 60 91 121 152 182 17 Jan. 2004 Image courtesy Helen Quinby
Sedimentation at 170 meters Annual sedimentation Year mgC m-2 y-1 %PP 1994 1057 1.8 1995 3467 2.0 1996 3308 0.9 1997 402 0.2 1998 3164 3.0 1999 3082 6.6 !! 2003 1769 1.0
CONCEPTUAL MODEL OF SIZ DYNAMICS Ice extent & retreat bloom sedimentation
ICE RETREAT, PRIMARY PRODUCTION AND SEDIMENTATION ICE RETREAR & PP ICE AREA AND RETREAT
SEA ICE VARIABILITY AND WATER COLUM PROCESSES SUMMARY • +/- 10-25% variations in ice translate to order of magnitude • interannual variability in PP and sedimentation • Sea ice coverage and duration (day of retreat) appear to • influence annual variations in production and sedimentation • 1999: “average” sedimentation but anomalous high relative • to PP and ice retreat…a year dominated by salps not krill. • Need more years!!
2. COMPARATIVE FOOD WEB STRUCTURE EFFECTS OF PHYTOPLANKTON COMPOSITION • HOW DOES PHYTOPLANKTON COMMUNITY STRUCTURE INFLUENCE BIOGEOCHEMICAL PROCESSES? • COMPARISON OF FOODWEBS IN ROSS SEA POLYNYA • AND WEST ANTARCTIC PENINSULA IN JANUARY • USING AN INVERSE APPROACH • Fates of primary production • POC and DOC fluxes • Foodweb characterization (Legendre & Rassoulzedegan)
PLANKTON BENTHOS FISH FOODWEB RECONSTRUCTION Chesapeake Bay
ROSS SEA POLYNYA STUDY REGION Arrigo et al. Science 1999 ROSS SEA POLYNYA STUDIED INTENSIVELY 1994-1999 US JGOFS AESOPS PROGRAM ROAVERRS PROGRAM ITALIAN RESEARCH IN TERRA NOVA BAY PHYTOPLANKTON COMMUNITIES WELL CHARACTERIZED
ROSS SEA vs WAP • ROSS: dominated by Phaeocystis. • WAP: diatoms • ROSS: grazer biomass low (but few data for polynya) • WAP: dominated by krill • BACTERIAL PRODUCTION is ~10% of annual NPP • and lower during bloom. • ROSS: dominated by POC accumulation • WAP: ???
RECONSTRUCTING FOODWEBS: THE PROBLEM • MEASUREMENTS ARE NOT ADEQUATE TO FULLY SPECIFY FLOW STRUCTURES IN FOODWEBS. MANY PATHWAYS OR COMPARTMENTS CANNOT BE MEASURED EASILY OR ROUTINELY. • WHAT LEVEL OF DETAIL IS NECESSARY? • FUNCTIONAL GROUPS? INDIVIDUAL SPECIES?
WAP 1996:Only 6 out of 46 flows measured. GPP Large Phyto Small Phyto Protoz Bacteria DOC Detritus Krill Microzoo Myctophids Adelie Penguins Export Respiration Measurements Unknown
AGGREGATED FOOD WEB STRUCTURE Small phytoplankton* Phaeocystis colonies Diatoms Protozoan grazers Microzooplankton Krill +Mesozooplankton Myctophids Penguins Bacteria Detritus DOC *mostly Phaeocystis unicells < 5 um. Flows proportional to width of arrows
THE INVERSE METHOD • APPROACH BORROWED FROM GEOPHYSICS (EG, SEISMOLOGY). APPLIED TO FOODWEB RECONSTRUCTION BY VEZINA AND PLATT (1986) – GROWING NUMBER OF STUDIES. • USES OBSERVATIONS AND KNOWN BIOLOGICAL CONSTRAINTS (EG, GROWTH & ASSIMILATION EFFICIENCY, BIOMASS-SPECIFIC RESPIRATION) TO GIVE BEST-FIT PATTERNS OF FLOWS IN SPECIFIED FOODWEBS. • IN ESSENCE, SOLVING SYSTEMS OF LINEAR BALANCE EQUATIONS. NONSTEADY STATES ARE ADDRESSED. • PROVIDES AND OBJECTIVE AND CONSISTENT METHOD FOR FOODWEB RECONSTRUCTION. DIFFERENT ASSUMPTIONS CAN BE TESTED.
INPUT DATA: ROSS OBSERVATIONS (Primary & Bacterial Production) Primary production Bacterial production mMol C m-2 d-1 1997 1997 NPP data courtesy Walker Smith
INPUT DATA: ROSS OBSERVATIONS (POC and DOC accumulation) POC Accumulation % Cumulative NPP 0 20 40 60 80 100 Total DOC Production DOC Accumulation ROSS SEA SARGASSO SEA Carbon budgets during 60-70 d spring blooms Courtesy Craig Carlson
INPUT DATA: WAP OBSERVATIONS (example) Observations taken from grid stations within Adelie penguin foraging region determined with remote transmitters on birds. 1996 Foraging 1999 Foraging
INPUT DATA: WAP OBSERVATIONS (example) Zoop 3
WAP 1996 GPP = 1200 ROSS SEA 96 GPP = 550 1.26 0.1% 2.16 0.4%
RESULTS: FATE of PRIMARY PRODUCTION West Antarctic Peninsula: Grazer-dominated system ProtoZ MicroZ MesoZ DOC Detritus Ross Sea: Detritus-dominated system ProtoZ MicroZ MesoZ DOC Detritus
RESULTS: DOC and POC PRODUCTION DOC DET WAP DOC DET ROSS DOC DET N Atlantic
Diatom PHAEO RESULTS: FOODWEB CLASSIFICATION after Legendre and Rassoulzedegan, 1996 • Key Structuring Flows • In the foodweb: • Large Phytoplankton • Production (PT) Small PH PROTO MICRO BACT MESOZ DOC MYCTO DETR PENG EXPORT Flows normalized to total NPP
Diatom PHAEO RESULTS: FOODWEB CLASSIFICATION • Key Structuring Flows • In the foodweb: • Large Phytoplankton • Production • Consumption and • export via large • grazers & predators • (FT) Small PH PROTO MICRO BACT MESOZ DOC MYCTO DETR PENG EXPORT Flows normalized to total NPP
Diatom PHAEO RESULTS: FOODWEB CLASSIFICATION • Key Structuring Flows • In the foodweb: • Large Phytoplankton • Production • Consumption and • export via large • grazers & predators • Ungrazed, sinking • phytoplankton (DT) Small PH PROTO MICRO BACT MESOZ DOC MYCTO DETR PENG EXPORT Flows normalized to total NPP
Diatom PHAEO RESULTS: FOODWEB CLASSIFICATION • Key Structuring Flows • In the foodweb: • Large Phytoplankton • Production (PL) • Consumption and • export via large • grazers & predators • (FT) • Ungrazed, sinking • phytoplankton (DT) • Recycled flows • via detritus and DOC • = 1-(FT + DT) Small PH PROTO MICRO BACT MESOZ DOC MYCTO DETR PENG EXPORT Flows normalized to total NPP
Legendre & Rassoulzedegan • Foodweb models PL/PT RT/PT FT/PT DT/PT • Sinking of ungrazed cells 1.00 0 0 1.00 • Herbivorous foodweb 0.80 0.30 0.60 0.10 • Multivorous foodweb 0.35 0.60 0.30 0.10 • Microbial foodweb 0.10 0.80 0.20 0 • Microbial Loop 0 1.00 0 0 • INVERSE RESULTS • North Atlantic Bloom 0.50 0.780.040.18 • WAP 1996 0.670.69 0.19 0.11 • ROSS SEA 1996 0.540.470.02 0.50 RESULTS: FOODWEB CLASSIFICATION
COMPARATIVE FOOD WEB STRUCTURE SUMMARY • PLAUSIBLE FOODWEBS, CONSISTENT WITH OBSERVATIONS, CAN BE RECOVERED FOR BOTH AREAS. • BOTH REGIONS DOMINATED BY LARGE PHYTOPLANKTON • BUT TAXON DIFFERENCES LEAD TO CONTRASTS IN GRAZER ABUNDANCE AND IMPACTS • WAP: GRAZER-DOMINATED SYSTEM • ROSS: DETRITAL-DOMINATED • MOST DETRITAL FLOW ORIGINATES FROM UNGRAZED PHYTOPLANKTON • FOODWEB STRUCTURE DOMINATED BY LARGE PHYTOPLANKTON BUT TEND TOWARDS MICROBIAL FOODWEB STRUCTURE – EVEN WITH LOW BP AND DOC.
FINAL THOUGHTS • IMPORTANCE OF SEA ICE IN STRUCTURING SYSTEMS • NEED TO WORK LONG TERM AT REGIONAL SCALES • NEED FOR MODELS TO INTEGRATE SPARSE OBSERVATIONS
ACKNOWLEDGEMENTS and THANKS Palmer LTER Colleagues US JGOFS Colleagues: Walker Smith & Bob Anderson (AESOPS) ROAVERRS Project: Jack DiTullio et al. George Jackson & Tammi Richardson (TAMU – inverse models) Helen Quinby, Joann Kelly and many others for lab help NSF-OPP Andy Clarke and EASIZ, for the invitation All of you, for your attention
Inshore, local area sampling Twice per week, October - April
PALMER MEAN ANNUAL TEMPERATURE 1979-2003 PALMER MEAN SEA ICE EXTENT 1979-2003
Open water in ice margin and primary production More open ice margin, less PP
Sea Ice Area and Day of Retreat larger area – later retreat