Download
1 / 16
160 likes | 174 Views
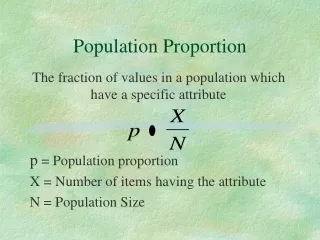
Section 8.2 Estimating a Population Proportion. Section 8.2 Estimating a Population Proportion. After this section, you should be able to… CONSTRUCT and INTERPRET a confidence interval for a population proportion

E N D
Section 8.2 Estimating a Population Proportion
Section 8.2Estimating a Population Proportion After this section, you should be able to… • CONSTRUCT and INTERPRET a confidence interval for a population proportion • DETERMINE the sample size required to obtain a level C confidence interval for a population proportion with a specified margin of error • DESCRIBE how the margin of error of a confidence interval changes with the sample size and the level of confidence C
Conditions for Estimating p Check the conditions for estimating p from our sample. Random: The class took an SRS of 251 beads from the container. Normal: Both np and n(1 – p) must be greater than 10. Since we don’t know p, we check that The counts of successes (red beads) and failures (non-red) are both ≥ 10. Independent: Since the class sampled without replacement, they need to check the 10% condition. At least 10(251) = 2510 beads need to be in the population. The teacher reveals there are 3000 beads in the container, so the condition is satisfied. IF ALL three conditions are met, it is safe to construct a confidence interval. We can replace p with p hat and calculate a confidence interval.
Constructing a Confidence Interval for p We can use the general formula from Section 8.1 to construct a confidence interval for an unknown population proportion p: When the standard deviation of a statistic is estimated from data, the results is called the standard error of the statistic.
One-Sample z Interval for a Population Proportion Once we find the critical value z*, our confidence interval for the population proportion p is One-Sample z Interval for a Population Proportion Choose an SRS of size n from a large population that contains an unknown proportion p of successes. An approximate level Cconfidence interval for p is where z* is the critical value for the standard Normal curve with area C between – z* and z*. Use this interval only when the numbers of successes and failures in the sample are both at least 10 and the population is at least 10 times as large as the sample.
One-Sample z Interval for a Population Proportion Calculate and interpret a 90% confidence interval for the proportion of red beads in the container. Your teacher claims 50% of the beads are red. Use your interval to comment on this claim. The sample proportion you found was 0.426. • For a 90% confidence level, z* = 1.645
One-Sample z Interval for a Population Proportion Calculate and interpret a 90% confidence interval for the proportion of red beads in the container. Your teacher claims 50% of the beads are red. Use your interval to comment on this claim. The sample proportion you found was 0.426. For a 90% confidence level, z* = 1.645 statistic ± (critical value) • (standard deviation of the statistic) 0.426 +/- 1.645 *
One-Sample z Interval for a Population Proportion Calculate and interpret a 90% confidence interval for the proportion of red beads in the container. Your teacher claims 50% of the beads are red. Use your interval to comment on this claim. We are 90% confident that the interval from 0.375 to 0.477 captures the actual proportion of red beads in the container. Since this interval gives a range of plausible values for p and since 0.5 is not contained in the interval, we have reason to doubt the claim.
The Four-Step Process We can use the familiar four-step process whenever a problem asks us to construct and interpret a confidence interval. Confidence Intervals: A Four-Step Process State: What parameter do you want to estimate, and at what confidence level? Plan:Identify the appropriate inference method. Check conditions. Do: If the conditions are met, perform calculations. Conclude:Interpret your interval in the context of the problem.
Choosing the Sample Size In planning a study, we may want to choose a sample size that allows us to estimate a population proportion within a given margin of error. The margin of error (ME) in the confidence interval for p is • z* is the standard Normal critical value for the level of confidence we want.
Choosing the Sample Size Sample Size for Desired Margin of Error To determine the sample size n that will yield a level C confidence interval for a population proportion p with a maximum margin of error ME, solve the following inequality for n:
Example: Customer Satisfaction Determine the sample size needed to estimate p within 0.03 with 95% confidence. • The critical value for 95% confidence is z* = 1.96.
Example: Customer Satisfaction Determine the sample size needed to estimate p within 0.03 with 95% confidence. • The critical value for 95% confidence is z* = 1.96. • Since the company president wants a margin of error of no more than 0.03, we need to solve the equation Multiply both sides by square root n and divide both sides by 0.03. We round up to 1068 respondents to ensure the margin of error is no more than 0.03 at 95% confidence. Square both sides. Substitute 0.5 for the sample proportion to find the largest ME possible.
Section 8.2Estimating a Population Proportion Summary In this section, we learned that…
Section 8.2Estimating a Population Proportion Summary In this section, we learned that… • When constructing a confidence interval, follow the familiar four-step process: • STATE: What parameter do you want to estimate, and at what confidence level? • PLAN: Identify the appropriate inference method. Check conditions. • DO: If the conditions are met, perform calculations. • CONCLUDE: Interpret your interval in the context of the problem. • The sample size needed to obtain a confidence interval with approximate margin of error ME for a population proportion involves solving