Download

1 / 24
240 likes | 370 Views
The role of evaporative demand in drought monitoring. Mike Hobbins, Andy Wood, and Kevin Werner Colorado Basin River Forecast Center (CBRFC) NWS-NOAA, Salt Lake City, UT. Outline. Background Current use o f evaporation information in drought monitoring Complementarity of ET and E 0

E N D
The role of evaporative demand in drought monitoring Mike Hobbins, Andy Wood, and Kevin Werner Colorado Basin River Forecast Center (CBRFC) NWS-NOAA, Salt Lake City, UT
Outline • Background • Current use of evaporation information in drought monitoring • Complementarity of ET and E0 • Potential roles for E0 in drought monitoring • Summary
1. Background • ET is the supply of water from land to atmosphere • droughts: ET decreases due to moisture limitations at the surface • E0is the atmospheric demand for water from the surface, akin to potential ET • the maximal rate of ET: moisture not limiting • absent information on soil/plant moisture availability, E0 drives hydrologic bucket models and LSMs • observation-based: Epan • temperature-based: Thornthwaite, Hamon, Hargreaves, Blaney-Criddle • physically based: E0= f(T, RH, Wind, Rn, surface parameters) (Penman-related combination equations) • E0is driven by ET • land surface-atmosphere feedback mechanisms
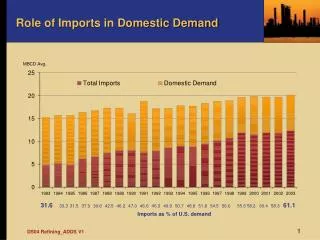
2. Current use of evaporation information in drought monitoring ET deficits from NLDAS data: Xia and Ek, 2011 • NLDAS/LSM driven ET deficits (anomalies and percentiles) • taken up by US Drought Monitor
2. Current use of evaporation information in drought monitoring E0: Driving PDSI and other bucket models 10o S T PDSI’s native E0 is a function of T alone 50o S • Hobbins et al. GRL 2008
2. Current use of evaporation information in drought monitoring E0: Driving PDSI and other bucket models – dangers T trends (°C/year) 1975-2004 29 (9) warming 6 (0) cooling Aus: +0.01 NZ: +0.02 Prcp trends (mm/yr2) 1975-2004 17 (1) increasing 18 (5) decreasing Aus: +0.10 NZ: -3.24 [Hobbins et al., Geophysical Research Letters, 2008] Hobbins et al., GRL, 2008
2. Current use of evaporation information in drought monitoring E0: Driving PDSI and other bucket models – dangers – drought trends Wetness Index: Annual Prcp/E0 Hobbins et al., GRL, 2008
2. Current use of evaporation information in drought monitoring E0: Driving PDSI and other bucket models – dangers – drought trends (1975-2004) E0PDSI-forced trends E0Pan-forced trends Soil moisture trends (mm/yr) Aus: -0.27 Aus: -0.05 NZ: -0.19 NZ: -0.05 E0trends (mm/yr2) Aus: +1.1Aus: -2.0 NZ: +1.0 NZ: -1.2 No significant relation between SMPan and SMPDSI 7 sites show opposite SM-trends: 5 in SW WA, NSW and Vic. ET trends (mm/yr2) Aus: +0.5 Aus: +0.2 NZ: +0.5 NZ: -0.9 Hobbins et al., GRL, 2008
2. Current use of evaporation information in drought monitoring E0: Driving PDSI and other bucket models – dangers – drought trends Budyko curve 1.2 Energy limit 1.0 New Zealand Water limit 0.8 ET / Ep 0.6 0.4 Australia 0.2 0.0 0 1 2 3 4 5 Prcp / Ep General forcing of actual ET: sensitivity of ET to DE0and DPrcp Prcp-forcing (constant E0) E0-forcing (constant Prcp) ETPan model Annual ET response (mm) ETPDSI model Annual Prcp anomaly (mm) Annual E0anomaly (mm)
2. Current use of evaporation information in drought monitoring Contrary observations • CONUS - drought trends: • Variable Infiltration Capacity model • 1915-2003 • Prcp, T, U2, Vegetation and Topography • findings: • US generally wetting (exception is Southwest) • SM - 44% of US is wetting, 3% drying (95% sig.) • Runoff - 28% stations increasing, 3% decreasing • droughts shorter, less severe, less frequent, less widespread Annual soil moisture trends Andreadis and Lettenmaier, GRL, 2006 Ukraine - SM averaged across 150 stations (JJA): dPrcp/dt = -0.031 mm/yr2 dT/dt = +0.015 K/yr yet: dSM/dt > 0. Robock et al., GRL, 2005 China - comparing Ep trends: T increasing in all river basins, SW and U2 decreasing All basins, dEp[Thorn.]dt > 0 80% basins, dEp[Thorn.]/dt opposite to dEp[Pan]/dt Chen et al., Climate Research, 2005
3. The complementarity of ET and E0 • ETwWet Environment Evaporation - rate under conditions where the only limitation is the availability of energy; • ETActual Evapotranspiration - occurs under conditions of limited moisture availability; • E0Evaporative demand / potential evaporation- theoretical rate under conditions of limited moisture availability if the resulting excess in surface energy is used to evaporate further moisture. ET under traditional paradigm –q2 E0 +q1 q1 ETw E0 ET rates ET rates q2 q1=q2 ET ET Increasing moisture availability Increasing moisture availability Complementary relationship considers three evaporation measures:
3. The complementarity of ET and E0 Complementarity observed across CONUS E0 ET rates ET Moisture availability • Hobbins et al. GRL 2004
4. Two potential roles of E0 in drought monitoring Climatology/forecast system driving bucket models and other tools • ETrc = reference crop ET • λ = latent heat of vaporization • T = 2-m air temperature • Δ = desat/dT at T • γ = psychrometric constant • Qn = net available energy for ET • esat = saturated vapor pressure • ea = actual vapor pressure • U2 = 2-m wind speed Penman-MonteithETrc(standard FAO-56 formulation) Mean annual Penman-MonteithETrc Weighted combination of radiative and advective drivers. reference crop is specified: • well-watered grass, • actively growing, • 0.12 m in height, • completely shading the ground, • albedo of 0.23. ETrc then multiplied by factors describing soil moisture, stress, and phenology, to yield an actual ET estimate, e.g.: • January 1, 1979 to near-present • 1/8-degree resolution • Hourly input data • 6-hourly and daily output time-step • CONUS-wide
4. Two potential roles of E0 in drought monitoring Climatology/forecast system driving bucket models and other tools • Reanalysis:North American Land Data Assimilation System (NLDAS) • T, Air temperature at 2-m elevation • q, Specific humidity at 2 m • Rd, Down-welling SW radiation • Ld, Down-welling LW radiation • Pa, Station pressure • U10, Wind speed at 10 m • Hourly time-step • 0.125-deg (~12 km) resolution • Jan 1, 1980, to Dec 31, 2009 • Forecast: National Digital Forecast Database (NDFD) • T, Air temperature at 2 m • Tdew, Dewpoint at 2 m • U2, Wind speed at 2 m • ECA, Effective cloud amount • Hourly, 3-hourly, or 6-hourly time-steps • 2.5-km / 5-km resolution HRAP grid • Seven new NLDAS-driven reanalyses • and forecasts of E0: • Physically based models: • Penman-MonteithETrc • Kimberly Penman ETrc • Penman Ep • Penman-MonteithEp • PenPanEpan • Temperature-based models: • Hargreaves ETrc • HamonEp Climatologic annual ETrc (mm), 1980-2009 Forecast daily ETrc (mm), May 3, 2010
4. Two potential roles of E0 in drought monitoring Eo forecast across the CBRFC: 24 hr forecasts from 12Z 4/24/2010 PenPanEpan Penman-MonteithEp HamonEp Kimberly Penman ETrc Penman Ep Hargreaves ETrc Penman-MonteithETrc Temperature-based vs. Physically based data requirements vs. physics 0 mm/day 3 6 9 12
4. Two potential roles of E0 in drought monitoring Drivers of E0 variability, NLDAS-driven E0, 1980 - 2009 January Annual T q T SWdn covs July covs SWdn T U10 SWdn covs q q • T = 2-m air temperature • q = specific` humidity • SWdn = downward shortwave • U10 = 10-m wind speed • covs = covaryingdrivers During summer growing season, T is not the dominant driver over much of CONUS: SWdn, covariances, and U10
4. Two potential roles of E0 in drought monitoring Issues with T-based models: Decomposing E0forcings – the PenPan model VPD = vapor pressure deficit dE0/dt= -2.0 mm/yr2 dE0,Advective/dt = -2.6 mm/yr2 dE0,Radiative/dt= +0.6 mm/yr2 dVPD/dt = -0.2 Pa/yr dE0,VPD/dt= 0.0 mm/yr2 dU2/dt = -0.01 m/sec/yrdE0,U2/dt= -2.7 mm/yr2 Roderick et al. GRL, 2007
4. Two potential roles of E0 in drought monitoring Evaporative Demand Drought Index, EDDI 2002 drought examined at Lakewood, CO > 0 positive anomaly in evaporative demand, DROUGHT X = 0 expected evaporative demand < 0 negative anomaly in evaporative demand
4. Two potential roles of E0 in drought monitoring Evaporative Demand Drought Index, EDDI 1979 2002 2011 • Penman-MonteithETrc-driven EDDI • Climatology 1980-2009 • Jan 2, 1979 to Mar 8, 2011, for Lakewood, CO
4. Two potential roles of E0 in drought monitoring Evaporative Demand Drought Index, EDDI Penman-MonteithETrc-driven EDDI April 1 – September 30, 2002 1980-2009 climatology SMpercentiles from Surface Water Monitor September 1, 2002 1960-2003 climatology Wood, 2008
4. Two potential roles of E0 in drought monitoring Evaporative Demand Drought Index, EDDI EDDI: April 1 – September 30, 2002
5. Summary Applications • A verified, high-resolution E0 could make a significant contribution to US drought analysis and mitigation: • US Drought Monitor • River Forecast Center operations • daily forecasting flows - hydrologic drought • seasonal - water supply • utility districts’ demand-planning; trans-mountain diversions; reservoir operations; hydrologic science community. • long-term drought trends • improved PDSI-analyses in Hobbins et al. [2008] • significant differences in drought trend direction, depending on E0-type used
5. Summary • Take advantage of the complementarity of ETand E0 • drought: ET deficits, E0 surpluses • US Drought Monitor • current evaporation information limited to: • ET (using LSMs) • physics-poor implementations of E0 (PDSI) • no explicit E0 input • forecast drought development (daily to weekly time-scale) • E0 would have a ~five-day latency • Developed a 31+-year, daily, CONUS-wide climatology, of seven E0 measures, updated to near-real-time: • filling the latency gap (NLDAS ~5 days): • with quick-look (NLDAS) forcing data • with (NDFD) forecasts from start of data lacuna (i.e., ~5 days) • data will be available for 7 E0 models (5 physical, 2 T-based), Jan 2, 1979 – near-present • currently forecasting 1- and 7-day ETrc • (At least) two potential roles for E0 in drought monitoring: • driving current hydrologic operations (e.g., PDSI) • Evaporative Demand Drought Index (EDDI)
Take Home Messages • E0reflects surface moisture anomalies, throughET • E0 can be a flexible driver for drought monitoring: • remotely sensed, land-based, or physically observed • forecastable • doesn’t rely on LSMs • E0can be estimated or observed simply, • but not too simply • T should not be used alone to drive E0 • often T-driven E0 is hidden