Download
1 / 15
150 likes | 282 Views
Challenges in Drought Monitoring and Prediction:. Kingtse Mo Climate Prediction Center, NCEP/NWS/ Noaa. Soil moisture % from ensemble NLDAS Agricultural drought. NCEP/EMC. U Washington.

E N D
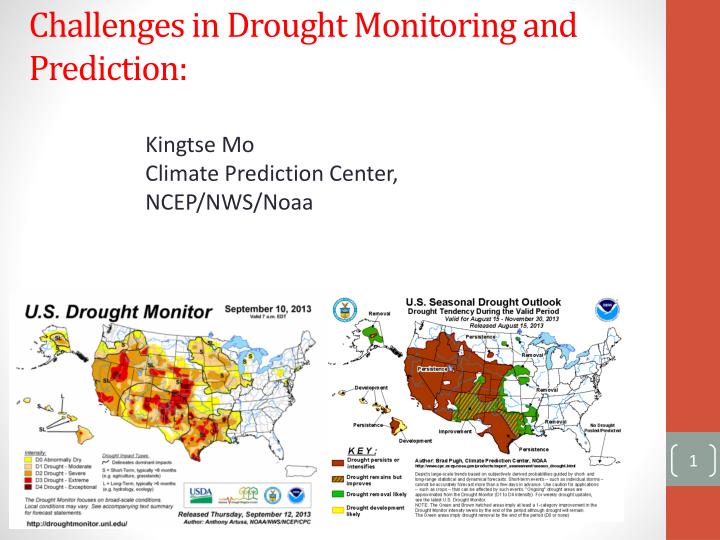
Challenges in Drought Monitoring and Prediction: Kingtse Mo Climate Prediction Center, NCEP/NWS/Noaa
Soil moisture % from ensemble NLDAS Agricultural drought NCEP/EMC U Washington Both captures the wetness over the Eastern and East-Central regions of the United States and dryness over the Southwest and the Plains, But intensity differs
Differences are large in the real time period • Differences between two systems are larger than the spread among members of the same system • The differences are not caused by one model. They are caused by forcing. • In general, SM anomalies from the UW (Green) are larger than from the NCEP (red) Real time Historical period standardized SM anomalies for area 38-42N,110-115W NCEP(red),UW(green)
Experiments (CPC and UW) • The VIC model of 0.5 degrees resolution from the UW system was chosen for experiments. • All experiments started from Jan 1 1979 using the same initial conditions from the UW VIC model in the UW system. • Experiments end on 31Dec 2008 • Forcing terms have two components • P forcing :Precipitation • F forcing : Tmax, Tmin and wind speed Mo et al. 2012 JHM
Four experiments • Comparison between • Exp (P uw F uw) vsExp(Pncep,Fuw) and • Exp (Puw, Fncep) vsExp(Pnecp,Fncep) indicates the differences caused by Precip • Comparison between • Exp (P uw F uw) vsExp(Puw,Fncep) and • Exp (Pncep, Fuw) vsExp(Pnecp,Fncep) indicates the differences caused by F forcing (Tsurf and winds)
Experiments :RMS differences of SM % Same F forcing Same P forcing Large differences between experiments with the same F forcing but different P forcing
Challenges: improving drought monitoring Number of reports /month averaged over the box Large drop in real time Improve real time Precipitation data and analyses —GPM can help 9
Real time SPI fcsts in operation since Jan 2013 Example: 201308 verification
SPI forecast If you have precip monthly mean fcsts, you can have the SPI forecasts CGCM Yoon et al. JHM 2012 Yoon et al. (2012), JHM SPI3 at lead-1 has 2 months P analysis and one month predicted P
SPI3 Lead=1 mo: High skill contribution from P analysis—CPC gauge analysis
Water storage in the Murray Darling Basin (Australia) from BMRC- Australia Big dry august Multi year drought Murray Darling basin (dry area with weak annual cycle)
SPI3 prediction for the Australia 2006 August CPC Gauge Chen at al GPCC Lead -1 GPCC captures the drought Lead-3
Seasonal mean P anomaly for JJA 2006 The reason that the GPCC captures the Australia drought in 2006 JJA is that the GPCC has better analysis and The dryness can be found in the seasonal mean of JJA 2006 BUT GPCC is not real time operation CPC Gauge
Satellite data used for monitoring • Directly • Evaporative Stress Index– Martha Anderson • Advantages _ no NLDAS model used ( independent index) • Disadvantage – not for winter Indirectly– through P analysis Gauge-OLR based Precip–PingpingXie
Discussion • Better Precipitation Analysis will improve drought or extreme events monitoring and prediction • For gauge only products, the real time data inputs have been poor(drop one third), satellite data can fill the gap. • Satellite rainfall from CMROPH etc does not have long enough records to use for monitoring of climate drought /extreme events –Merged products? • In verification, intraseaonal oscillations and many others, satellite rainfall can be valuable • To be useful to our applications, we need real time operation.