Download
1 / 11
110 likes | 285 Views
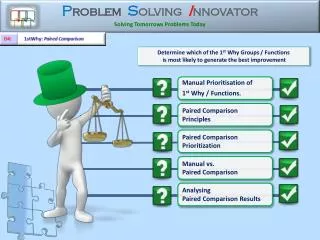
Determine which of the 1 st Why Groups / Functions is most likely to generate the best improvement. Manual Prioritisation of 1 st Why / Functions. Paired Comparison Prioritization. Manual vs. Paired Comparison. Analysing Paired Comparison Results. Paired Comparison Principles.

E N D
Determine which of the 1st Why Groups / Functions is most likely to generate the best improvement • Manual Prioritisation of • 1st Why / Functions. • Paired Comparison Prioritization Manual vs. Paired Comparison Analysing Paired Comparison Results • Paired Comparison Principles
Manual Prioritisation of • 1st Why / Functions. Now that the Affinity Diagram is built… The Groups can be PRIORITIZEDdepending on the Teams opinion as to which Group is most likely to hold the actual ROOT CAUSE. This can be done … by allocating a simple Alpha or Numerical Scale (of the users choice) OR the Team can use the more accurate and scientific , Paired Comparison method. B
Paired Comparison Principles Paired Comparison derives its name from “comparing” pairs of possibilities. Itforces people to make a “second choice”. It also eliminatesundue influence by other Team Members, thereby establishing if the Team has genuine consensus on where (which Group) the Root Cause may lie. The results are displayedin a % format which represents the Teams overall opinion.
Conduct Paired Comparison A copy of the Paired Comparison sheet can be PRINTED out to allow each Team Member to complete the voting process in private. This is the PREFERRED METHOD due to the fact that it discourages the influence others may have on each other during the VotingProcess.
Manual vs. Paired Comparison The % value of the result of the TeamsScoringis displayed on the Affinity Diagram. 29 24 16 29 2 If they are SIGNIFICANT, then the Teams understanding of the Problem & its Potential Causes should be reviewed. The results of the simple alpha /numericalscale and the more scientific Paired Comparison should be COMPARED FOR ANOMALIES.. 1st 2nd 3rd 4th 5th 6th
Analysing Paired Comparison Results (1) From the Paired Comparison results , it becomes clear that the Team has little consensus as to within what Group the ROOT CAUSE may lie. The Team does however agree, that Raw Material is unlikely to be a CAUSE the Problem. It is essential that the Team has reasonable consensus, before progressing deeper into the PROBLEM ANALYSIS!
Analysing Paired Comparison Results (2) With JADES agreement, (as she is the only one who slightly disagrees) we can eliminate “A” from the voting and see if that makes any difference. DESIGN/ APPLICATION has DECREASED. That is because the team were asked to make a choice between DESIGN/APPLICATION and RAW MATERIAL; RAW MATERIAL was a non-starter, so this forced decision falsely inflated the result. Significantly, MACHINING has marginallyincreased in relation to TAPPING
Analysing Paired Comparison Results (3) Design/Application now has only 10% of the votes; so lets see what happens if we delete it. ASSEMBLY/TEST has now DECREASED. This time it is NOT because the Team was forced to make a decision between two wrongs. This time there is something else causing ASSEMBLY/TEST to drop. Here's the reason, JADE & HILDA prefer ASSEMBLY / TEST over TAPPING also DANITA prefers ASSEMBLY / TEST over MACHINING Whenever there is a change in the indicated priority, it is important not to just ignore it, but to LOGICALLY UNDERSTAND WHY and if necessary address that reason with the Team
Analysing Paired Comparison Results (4) DANITA has previously voted for MACHINING and both JADE & HILDA have previously voted for TAPPING, so there is not an aversion to either of these. After some technical discussion the Team experiment with reversingJADE & HILDA'S decisions . The experiment made it apparent that the Team is split between MACHINING & TAPPING. BothGroups will now have to be analyzed further and the Team should specifically be looking for POTENTIAL CAUSES common to “both” Groups. Tapping Machining Machining Tapping The Team decided to revert to the INITIALPaired Comparison results because although the percentages differ, the prioritization remained the same before experimentation and after.
This completes the Paired Comparison Now start the 2nd and 3rd Why