Download
1 / 139
1.45k likes | 1.94k Views
Polynomial and Rational Functions. Chapter 3. TexPoint fonts used in EMF. Read the TexPoint manual before you delete this box.: A A A A. Quadratic Functions and Models. Section 3.1. Quadratic Functions. Quadratic function : Function of the form f ( x ) = ax 2 + bx + c

E N D
Polynomial and Rational Functions Chapter 3 TexPoint fonts used in EMF. Read the TexPoint manual before you delete this box.: AAAA
Quadratic Functions and Models Section 3.1
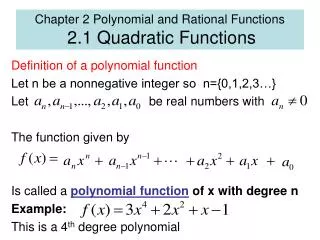
Quadratic Functions • Quadratic function: Function of the form f(x) = ax2 + bx + c (a, b and c real numbers, a≠ 0)
Quadratic Functions • Example. Plot the graphs of f(x) = x2, g(x) = 3x2 and
Quadratic Functions • Example. Plot the graphs of f(x) = {x2, g(x) = {3x2 and
Parabolas • Parabola: The graph of a quadratic function • If a> 0, the parabola opens up • If a< 0, the parabola opens down • Vertex: highest / lowest point of a parabola
Parabolas • Axisofsymmetry: Vertical line passing through the vertex
Parabolas • Example. For the function f(x) = {3x2 +12x { 11 (a) Problem: Graph the function Answer:
Parabolas • Example. (cont.) (b) Problem: Find the vertex and axis of symmetry. Answer:
Parabolas • Locations of vertex and axis of symmetry: • Set • Set • Vertex is at: • Axis of symmetry runs through vertex
Parabolas • Example. For the parabola defined by f(x) = 2x2 { 3x + 2 (a) Problem: Without graphing, locate the vertex. Answer: (b) Problem: Does the parabola open up or down? Answer:
x-intercepts of a Parabola • For a quadratic function f(x) = ax2 + bx + c: • Discriminant is b2 { 4ac. • Number of x-intercepts depends on the discriminant. • Positive discriminant: Two x-intercepts • Negative discriminant: Zero x-intercepts • Zero discriminant: One x-intercept (Vertex lies on x-axis)
Graphing Quadratic Functions • Example. For the function f(x) = 2x2 + 8x + 4 (a) Problem: Find the vertex Answer: (b) Problem: Find the intercepts. Answer:
Graphing Quadratic Functions • Example. (cont.) (c) Problem: Graph the function Answer:
Graphing Quadratic Functions • Example. (cont.) (d) Problem: Determine the domain and range of f. Answer: (e) Problem: Determine where f is increasing and decreasing. Answer:
Graphing Quadratic Functions • Example. Problem: Determine the quadratic function whose vertex is (2, 3) and whose y-intercept is 11. Answer:
Graphing Quadratic Functions • Method 1 for Graphing • Complete the square in x to write the quadratic function in the form y =a(x { h)2 + k • Graph the function using transformations
Graphing Quadratic Functions • Method 2 for Graphing • Determine the vertex • Determine the axis of symmetry • Determine the y-intercept f(0) • Find the discriminant b2 { 4ac. • If b2 { 4ac > 0, two x-intercepts • If b2 { 4ac = 0, one x-intercept (at the vertex) • If b2 { 4ac < 0, no x-intercepts.
Graphing Quadratic Functions • Method 2 for Graphing • Find an additional point • Use the y-intercept and axis of symmetry. • Plot the points and draw the graph
Graphing Quadratic Functions • Example. For the quadratic function f(x) = 3x2 { 12x + 7 (a) Problem: Determine whether f has a maximum or minimum value, then find it. Answer:
Graphing Quadratic Functions • Example. (cont.) (b) Problem: Graph f Answer:
Quadratic Relations • Example. An engineer collects the following data showing the speed s of a Ford Taurus and its average miles per gallon, M.
Quadratic Relations • Example. (cont.) (a) Problem: Draw a scatter diagram of the data Answer:
Quadratic Relations • Example. (cont.) (b) Problem: Find the quadratic function of best fit to these data. Answer:
Quadratic Relations • Example. (cont.) (c) Problem: Use the function to determine the speed that maximizes miles per gallon. Answer:
Key Points • Quadratic Functions • Parabolas • x-intercepts of a Parabola • Graphing Quadratic Functions • Quadratic Relations
Polynomial Functions and Models Section 3.2
Polynomial Functions • Polynomialfunction: Function of the form f(x) = anxn + an {1xn {1 + + a1x + a0 • an, an {1, …, a1, a0 real numbers • n is a nonnegative integer (an 0) • Domain is the set of all real numbers • Terminology • Leadingcoefficient: an • Degree: n (largest power) • Constantterm: a0
Polynomial Functions • Degrees: • Zero function: undefined degree • Constant functions: degree 0. • (Non-constant) linear functions: degree 1. • Quadratic functions: degree 2.
Polynomial Functions • Example. Determine which of the following are polynomial functions? For those that are, find the degree. (a) Problem:f(x) = 3x + 6x2 Answer: (b) Problem:g(x) = 13x3 + 5 + 9x4 Answer: (c) Problem:h(x) = 14 Answer: (d) Problem: Answer:
Polynomial Functions • Graph of a polynomial function will be smooth and continuous. • Smooth: no sharp corners or cusps. • Continuous: no gaps or holes.
Power Functions • Powerfunction of degree n: • Function of the form f(x) = axn • a 0 a real number • n> 0 is an integer.
Power Functions • The graph depends on whether n is even or odd.
Power Functions • Properties of f(x) = axn • Symmetry: • If n is even, f is even. • If n is odd, f is odd. • Domain: All real numbers. • Range: • If n is even, All nonnegative real numbers • If n is odd, All real numbers.
Power Functions • Properties of f(x) = axn • Points on graph: • If n is even: (0, 0), (1, 1) and ({1, 1) • If n is odd: (0, 0), (1, 1) and ({1, {1) • Shape: As n increases • Graph becomes more vertical if |x|> 1 • More horizontal near origin
Graphing Using Transformations • Example. Problem: Graph f(x) = (x { 1)4 Answer:
Graphing Using Transformations • Example. Problem: Graph f(x) = x5 + 2 Answer:
Zeros of a Polynomial • Zero or root of a polynomial f: • r a real number for which f(r) = 0 • r is an x-intercept of the graph of f. • (x { r) is a factor of f.
Zeros of a Polynomial • Example. Problem: Find a polynomial of degree 3 whose zeros are {4, {2 and 3. Answer:
Zeros of a Polynomial • Repeated or multiple zero or root of f: • Same factor (x { r) appears more than once • Zeroofmultiplicitym: • (x { r)m is a factor of f and (x { r)m+1 isn’t.
Zeros of a Polynomial • Example. Problem: For the polynomial, list all zeros and their multiplicities. f(x) = {2(x { 2)(x + 1)3(x { 3)4 Answer:
Zeros of a Polynomial • Example. For the polynomial f(x) = {x3(x { 3)2(x + 2) (a) Problem: Graph the polynomial Answer:
Zeros of a Polynomial • Example. (cont.) (b) Problem: Find the zeros and their multiplicities Answer:
Multiplicity • Role of multiplicity: • r a zero of even multiplicity: • f(x) does not change sign at r • Graph touches the x-axis at r, but does not cross
Multiplicity • Role of multiplicity: • r a zero of odd multiplicity: • f(x) changes sign at r • Graph crosses x-axis at r
Turning Points • Turning points: • Points where graph changes from increasing to decreasing function or vice versa • Turning points correspond to local extrema. • Theorem. If f is a polynomial function of degree n, then f has at most n { 1 turning points.