Download
1 / 143
1.75k likes | 3.6k Views
Title: Functions, Limits and Continuity. Prof. Dr. Nasima Akhter And Md. Masum Murshed Lecturer Department of Mathematics, R.U. 29 July, 2011, Friday Time: 6:00 pm-7:30 pm . Outline. Functions and its graphs. One-one, Onto and inverse functions. Transcendental functions.

E N D
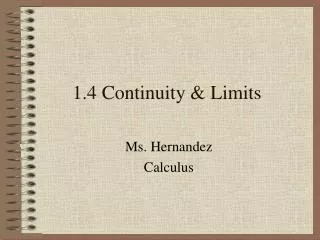
Title:Functions, Limits and Continuity Prof. Dr. Nasima Akhter And Md. Masum Murshed Lecturer Department of Mathematics, R.U. 29 July, 2011, Friday Time: 6:00 pm-7:30 pm
Outline • Functions and its graphs. • One-one, Onto and inverse functions. • Transcendental functions. • Bounded and monotonic functions. • Limits of functions. • Right and left hand limits. • Special limits. • Continuity. • Right and left hand continuity. • Sectional continuity. • Uniform continuity, Lipschitz continuity.
Outline • Functions and its graphs. • One-one, Onto and inverse functions. • Transcendental functions. • Bounded and monotonic functions. • Limits of functions. • Right and left hand limits. • Special limits. • Continuity. • Right and left hand continuity. • Sectional continuity. • Uniform continuity, Lipschitz continuity.
Functions and its Graphs X Y f y = f (x) x
Functions and its Graphs x f(x)
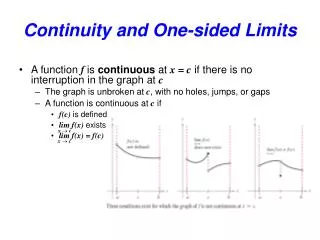
Functions and its Graphs X f Y y = f (x) x f :X → Y if for each x ∊ X ∃ a unique y ∊ Y such that y = f(x).
f Functions and its Graphs f f is not a function f is not a function f f f f is a function f is a function f is a function
Functions and its Graphs Real valued function X f Y = R f[X] = {f(x) : x ∊ X} Range of f y = f (x) x Domain of f Co-domain of f f :X → Y if for each x ∊ X ∃ a unique y ∊ Y such that y = f(x).
Functions and its Graphs Set function X f Y Range of f f[X] = {f(x) : x ∊ X} Class of sets y = f (x) Co-domain of f Domain of f f :X → Y if for each x ∊ X ∃ a unique y ∊ Y such that y = f(x).
Functions and its Graphs X f Y Range of f f(A) A f[A] = {f(x) : x ∊ A} y = f (x) Co-domain of f Domain of f If f :X → Y then ∃ two set functions f : 2X→ 2Yand f-1 : 2Y→ 2X
Functions and its Graphs X f Y B f-1(B) f -1(B) = {x ∊ X : f(x) ∊ B}. If f :X → Y then ∃ two set functions f : 2X→ 2Yand f-1 : 2Y→ 2X
Functions and its Graphs f f ({1, 3, 4}) = {a, b, d}, f ({2, 3}) = {a, d} f ({1, 2}) = {a}, also f -1({a, b, d})= {1, 2, 3, 4}, f -1({a})= {1, 2}, f -1({b, c})= {4}, f -1({c})= Ø,
Functions and its Graphs Between these two set functions f -1 plays very important role in topology and measure. Since f -1 preserves countable union, countable intersection, difference, monotonicity, complementation etc. i.e. Theorem If f :X → Y then for any subset A and B of Y, (i) f -1(A ∪ B) = f -1(A) ∪f -1(B). (ii) f -1(A ∩ B) = f -1(A) ∩f -1(B). (iii) f -1(A ∖ B) = f -1(A) ∖f -1(B). (iv) If A ⊆ B then f -1(A) ⊆f -1(B). (v) f -1(Ac) = (f -1(A))c. And, more generally, for any indexed {Ai} of subsets of Y, (vi) f -1( ∪i Ai) = ∪if -1(Ai). (vii) f -1(∩i Ai) = ∩if -1(Ai).
Functions and its Graphs X Y x y (x, y) X ⨉ Y = {(x, y) : x ∊ X , y ∊ Y} A relation from X to Y is a subset of X ⨉ Y.
Functions and its Graphs A function can also be described as a set of ordered pairs (x, y) such that for any x-value in the set, there is only one y-value. This means that there cannot be any repeated x-values with different y-values. A relation is called a function if for any x-value in the set, there is only one y-value. This means that there cannot be any repeated x-values with different y-values. g f f is not a function g is a function f = {(1, a), (1, b), (2, c), (3, c), (4, d)} is not a function. g = {(1, a), (2, a), (3, d), (4, b)} is a function.
Functions and its Graphs X, A subset of R Y, A subset of R y = f(x) x f (x, y) We plot the domain X on the x-axis, and the co-domain Yon the y-axis. Then for each point x in X we plot the point (x, y), where y = f(x). The totality of such points (x, y) is called the graphof the function.
Functions and its Graphs The Vertical Line Test This is not the graph of a function. The vertical line we have drawn cuts the graph twice. This is the graph of a function. All possible vertical lines will cut this graph only once.
Functions and its Graphs Now we consider some examples of real functions. Example 1. The identity function. Let the function f : R → R be defined by f(x) = x for all real x. This function is often called the identity function on R and it is denoted by 1R. Its domain is the real line, that is, the set of all real numbers. Here x = y for each point (x, y) on the graph of f. The graph is a straight line making equal angles with the coordinates axes (see Figure-1 ). The range of f is the set of all real numbers. Figure-1 Graph of the identity function f(x) = x.
Functions and its Graphs Example 2. The absolute-value function. Consider the function which assigns to each real number x the nonnegative number |x|. We define the function y = |x| as From this definition we can graph the function by taking each part separately. The graph of y = |x| is given below. Figure- 2 Graph of the absolute-value function y = f(x) = |x|.
Functions and its Graphs Example 3. Constant functions. A function whose range consists of a single number is called a constant function. An example is shown in Figure-3, where f(x) = 3 for every real x. The graph is a horizontal line cutting the Y-axis at the point (0, 3). Figure- 3 Graph of the constant function f(x) = 3.
Functions and its Graphs Example 4. Linear functions and affine linear function. Let the function g be defined for all real x by a formula of the form g(x) = ax + b, where a and b are real numbers, then g is called a linear function if b = 0. Otherwise, g is called a affinelinear function. The example, f(x) = x, shown in Figure-1 is a linear function. And, g(x) = 2x - 1, shown in Figure-4 is a affinelinear function. Figure- 4 Graph of the affinelinear function g(x) = 2x - 1.
Example 5. Functions and its Graphs The greatest integer function The greatest integer function is defined by f(x) = [x] = The greatest integer less than or equal to x. Figure- 5 shows the graph of f(x) = [x]. Figure- 5 Graph of the greatest integer function is defined by f(x) = [x].
Functions and its Graphs Example 6. Polynomial functions. A polynomial function P is one defined for all real a by an equation of the form P(x) = c0 + c1x + c2x2 + c3x3 + ……………+ cnxn The numbers c0 , c1, c2, c3,……………,cnare called the coefficients of the polynomial, and the nonnegative integer n is called its degree (if cn ≠ 0). They include the constant functions and the power functions as special cases. Polynomials of degree 2, 3, and 4 are called quadratic, cubic, and quartic polynomials, respectively. Figure-6 shows a portion of the graph of a quartic polynomial P given by P(x) = ½ x4 – 2x2. Figure- 6 Graph of a quartic polynomial function p(x) = ½ x4 – 2x2.
Functions and its Graphs f g are functions k = constant h1= f +g h2= f .g h3= f /g h4= k + f h5= k . f h6= f∘g h7= g∘ f
We can define Functions and its Graphs h1= f +g, h2= f .g , h3= f /g, h4= k + f and h5= k . f by h1(x)= (f +g)(x) = f(x) + g(x), h4(x)= (k + f)(x) = k + f(x) , h2(x)= (f .g)(x) = f(x) . g(x), h5(x)= (k . f)(x) = k . f(x) , h3(x)= (f /g)(x) = f(x) / g(x), if f and g are real valued and defined on the same domain X and k is a real number. Also we can define h6= f∘g and h7= g∘ f by h6(x)= (f∘g)(x) = f(g(x)) if co-domain of g = domain of f and h7(x)= (g∘f)(x) = g (f(x)) if co-domain of f = domain of g Generally, f∘g ≠ g∘ f
Composition Function If f : X → Y and g : Y → Z then we define a function (g∘ f) : X → Z by (g∘ f)(x) ≡ g(f(x)).
Composition Function Example Let f : X → Y and g : Y → Z be define by the following diagrams Then we can compute (g∘ f) : X → Z by its definition: (g∘ f)(a) ≡ g(f(a)) = g(y) = t (g∘ f)(b) ≡ g(f(b)) = g(z) = r (g∘ f)(c) ≡ g(f(c)) = g(y) = t Remark: Let f : X → Y. Then 1Y∘ f = f and f∘ 1X = f where 1X and 1Y are identity functions on X and Y respectively. That is the product of any function and the identity function is the function itself.
Functions and its Graphs Theorem: Let f : X → Y, g : Y → Zand h : Z → W.Then (h∘ g)∘ f = h∘ (g∘ f). Theorem Two functions f and g are equal if and only if (a) f and g have the same domain, and (b) f(x) = g(x) for every x in the domain of f.
Outline • Functions and its graphs. • One-one, Onto and inverse functions. • Transcendental functions. • Bounded and monotonic functions. • Limits of functions. • Right and left hand limits. • Special limits. • Continuity. • Right and left hand continuity. • Sectional continuity. • Uniform continuity, Semi-continuity, Lipschitz continuity.
One-one Function X Y Different elements of X Different elements of Y f is one-one f : X → Y is said to be one-one if f(x) = f(y) implies x = y or, equivalently, x ≠ y implies f(x) ≠ f(y).
One-oneFunction Examples (vi) Let X = {1, 2, 3, 4} and Y = {a, b, c, d, e} and f and g be two functions from X into Y given by the following diagrams Here g is a one-one function since different elements of X have different images. Here f is not a one-onefunction since a is the image of two different elements 1 and 2 of X.
Functions and its Graphs The Horizontal Line Test This is not the graph of a one- one function. The horizontal line we have drawn cuts the graph twice. This is the graph of a one- one function. All possible horizontal lines will cut this graph only once.
Examples One-oneFunction The function f : R → R defined by f(x) = x2is not a one-onefunction since f(2) = f(-2) = 4. Figure- 7 Graph of the function f(x) = x2.
Examples One-oneFunction The function f : R → R defined by f(x) = ex is a one-onefunction. Proof: Let f(x) = f(y) then ex = ey i.e. x = y Hence by definition f is a one-onefunction. Figure- 8 Graph of the function f(x) = ex.
Examples One-oneFunction The absolute-value function f : R → R defined by f(x) =|x|is not a one-onefunction since f(2) = f(-2) = 2. Figure- 9 Graph of the absolute-value function y = f(x) = |x|.
Examples One-oneFunction The identity function f : R → R defined by f(x) = x is a one-onefunction. Proof: Let f(x) = f(y) then x = y Hence by definition f is a one-onefunction. Figure- 10 Graph of the identity function f(x) = x.
Onto Function X Y Every element of Y is the image of some element of X f is onto f :X → Y is said to be onto if for every y ϵY, ∃ an element x ϵ X such that y = f(x), i.e. f(X) = Y.
Onto Function Examples (vi) Let X = A = {1, 2, 3, 4}, Y = {a, b, c} and B= {a, b, c, d, e} and f and g be two functions from X into Y and A into B respectively given by the following diagrams Here fis a ontofunction since every element of Y appears in the range of f Here g is not a onto function since e ∊ B is not an image of any element of A.
Onto Function The Horizontal Line Test This is not the graph of a onto function. the horizontal line drawn above does not cut the graph. This is the graph of a onto function. All possible horizontal lines will cut this graph at least once.
Onto Function Examples The function f : R → R defined by f(x) = ex is a not an ontofunction. Proof: Since -2 is an element of the co-domainR then there does not exist any element x in the domainR such that -2 = ex = f(x). Hence by definition f is not a ontofunction. Figure- 11 Graph of the function f(x) = ex.
Examples Onto Function The identity function f : R → R defined by f(x) = x is a ontofunction. Proof: Since for every y in the co-domainR, ∃ an element xin the domainR such that y = f(x). Hence by definition f is a ontofunction. Figure- 12 Graph of the identity function f(x) = x.
Examples Onto Function The function f : R → R defined by f(x) = x2is not an ontofunction. Proof: Since -2 is an element of the co-domainR then there does not exist any element x in the domainR such that -2 = x2 = f(x). Hence by definition f is not a ontofunction. Figure- 13 Graph of the function f(x) = x2.
Inverse Function f is one-one and onto X Y f x y = f(x) f -1
Example Let f : X → Y be define by the following diagram Inverse Function X Y Here f is one-one and onto. Therefore f -1, the inverse function, exists. We describe f -1: Y → X by the diagram Y X
Inverse Function Theorem on the inverse function. Theorem 1 Let the function f : X → Y be one-one and onto; i.e. the inverse function f -1: Y → X exists. Then the product function (f -1 ∘ f ) : X → X is the identity function on X, and the product function (f ∘ f -1) : Y → Y is the identity function on Y, i.e. (f -1 ∘ f ) = 1X and (f ∘ f -1) = 1Y. Theorem 2 Let f : X → Y and g : Y → X. Then g is the inverse of f, i.e. g = f -1 , if the product function (g∘ f ) : X → X is the identity function on X, and the product function (f ∘ g) : Y → Y is the identity function on Y, i.e. (g∘ f ) = 1X and (f ∘ g ) = 1Y.
Outline • Functions and its graphs. • One-one, Onto and inverse functions. • Transcendental functions. • Bounded and monotonic functions. • Limits of functions. • Right and left hand limits. • Special limits. • Continuity. • Right and left hand continuity. • Sectional continuity. • Uniform continuity, Lipschitz continuity.
Algebraic and Transcendental Functions Algebraic functions Algebraic functions are functions y = f (x) satisfying an equation of the form p0(x)yn + p1(x)yn-1 + . . . + pn-1(x)y + pn(x) = 0 …………………………… (1) where p0(x) , . . . , pn(x) are polynomials in x. If the function can be expressed as the quotient of two polynomials, i.e., P(x)/Q(x) where P(x) and Q(x) are polynomials, it is called a rational algebraic function; otherwise, it is an irrational algebraic function. Example is an algebraic function since it satisfies the equation (x2 – 2x + 1)y2 + (2x2 – 2x)y + (x2 – x) = 0. Transcendental functions Transcendental functions are functions which are not algebraic; i.e.,they do not satisfy equations ofthe form of Equation (1).
The following are sometimes called elementary transcendental functions. Algebraic and Transcendental Functions 1. Exponential function: f (x) = ax, a ≠ 0, 1. 2. Logarithmic function: f (x) = logax, a ≠ 0, 1. This and the exponential function are inverse functions. If a = e = 2.71828 . . . , called the natural base of logarithms, we write f (x) = logex = In x, called the natural logarithm of x. 3. Trigonometric functions: The variable x is generally expressed in radians (π radians = 180∘). For real values of x, sin x and cos x lie between –1 and 1 inclusive. 4. Inverse trigonometric functions. The following is a list of the inverse trigonometric functions and their principal values:
Outline • Functions and its graphs. • One-one, Onto and inverse functions. • Transcendental functions. • Bounded and monotonic functions. • Limits of functions. • Right and left hand limits. • Special limits. • Continuity. • Right and left hand continuity. • Sectional continuity. • Uniform continuity, Lipschitz continuity.
BoundedFunction Bounded function A function f defined on some set X with real values is called bounded, if the set of its values is bounded. In other words, there exists a real number M < ∞ such that |f(x)| ≤ M or –M ≤ f(x) ≤ M for all x in X. Geometrically, the graph of such a function lies between the graphs of two constant step functions s and t having the values — M and +M, respectively. Figure- 14 Graph of a bounded function. Intuitively, the graph of a bounded function stays within a horizontal band.