Download
1 / 27
270 likes | 341 Views
The 2012 Elections: A Viewer’s Guide. Direction of Country. Financial crisis. Bush re-elected. Sept. 11. Obama inaugurated. Right track. Wrong direction. Source: NYT/CBS News polls, 3/8/2001 to 6/2/2012. Trust In Our Institutions. Source: Gallup, Nov. 28-Dec. 1, 2011.

E N D
Direction of Country Financial crisis Bush re-elected Sept. 11 Obama inaugurated Right track Wrong direction Source: NYT/CBS News polls, 3/8/2001 to 6/2/2012
Trust In Our Institutions Source: Gallup, Nov. 28-Dec. 1, 2011
Voting Habits By Automobile Ownership • Dems Drive: • Hybrid vehicles • Subarus • Minis • Repubs Drive: • Jaguars • GMCs • Land Rovers • Lexuses
Voting Habits By Beer Preference • Dems drink: • Miller High Life • Guinness • Heineken • Corona • Repubs drink: • Michelob Ultra • Coors Light • Busch Light • Sam Adams
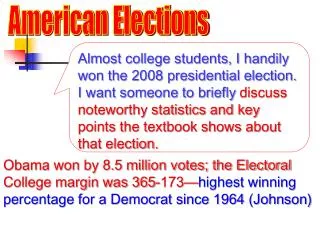
Obama’s Job Approval 1/25/2009 67% 5/3/2010 50% 50% 8/24/2009 40% 8/14/2011
Obama’s Job Approval 1/25/2009 67% OBL killed Debt ceiling fight 7/142011 46% 5/3/2010 50% Stimulus passes 50% 8/24/2009 Health care passes 40% 8/14/2011 Source: Gallup
U.S. Demographics 63.7% Hisp 12.6% Af Am 12.2% Asian 3.7% Hisp 9% Af Am 11.8% Asian 2.8%
U.S. Demographics 75.6% 69.4% 63.7% 33.2% 28.5%
Buy A Tivo In Millions of Dollars
The Swing State Polls Source: Real Clear Politics
Obama’s 2008 Margin By State 272 Electoral Votes
Congress’s Job Approval 50% 13%-16%
Historic House Turnover Recessions
House Turnover, 1980-2010 R+63 R+34 D+31 D+21
The Senate Landscape Current Makeup: 53 Democrats, 47 Republicans