Download
1 / 12
120 likes | 200 Views
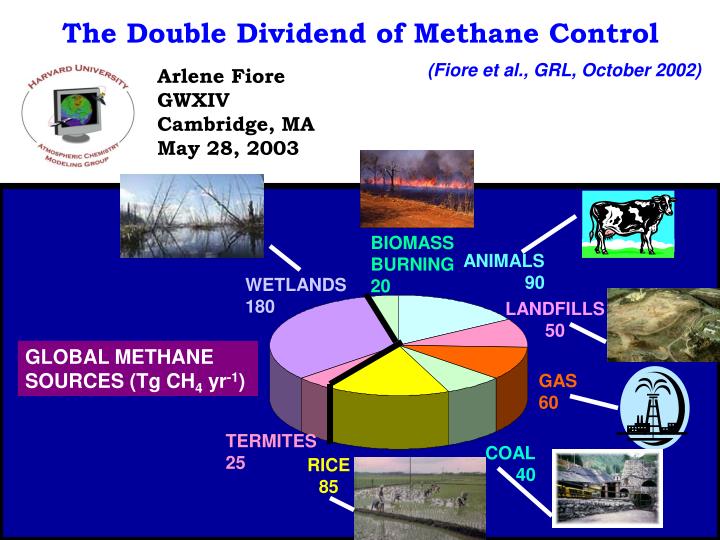
The Double Dividend of Methane Control. (Fiore et al., GRL, October 2002). Arlene Fiore GWXIV Cambridge, MA May 28, 2003. BIOMASS BURNING 20. ANIMALS 90. WETLANDS 180. LANDFILLS 50. GLOBAL METHANE SOURCES (Tg CH 4 yr -1 ). GAS 60. TERMITES 25. COAL 40. RICE 85.

E N D
The Double Dividend of Methane Control (Fiore et al., GRL, October 2002) Arlene Fiore GWXIV Cambridge, MA May 28, 2003 BIOMASS BURNING 20 ANIMALS 90 WETLANDS 180 LANDFILLS 50 GLOBAL METHANE SOURCES (Tg CH4 yr-1) GAS 60 TERMITES 25 COAL 40 RICE 85
Atmospheric CH4: Past Trends, Future Predictions IPCC [2001] Projections of Future CH4Emissions (Tg CH4) to 2050 Variations of CH4Concentration (ppbv) Over the Past 1000 years [Etheridge et al., 1998] Scenarios 1600 900 A1B A1T A1F1 A2 B1 B2 IS92a 1400 800 1200 700 1000 800 600 1500 1000 2000 2020 2040 2000 Year Year
Radiative Forcing of Climate, 1750-Present:Important Contributions from Methane and Ozone IPCC [2001] Level of scientific understanding
CH4 itself is an important greenhouse gas, and links climate with air pollution via its influence on tropospheric ozone O3 greenhouse gas Free Troposphere hn NO NO2 Hemispheric Pollution OH HO2 Boundary layer (0-2.5 km) Direct Intercontinental Transport VOC, CH4, CO air pollution (smog) NOx NMVOCs O3 NOx NMVOCs O3 air pollution (smog) CONTINENT 1 CONTINENT 2 OCEAN
Ozone abatement strategies evolve as our understanding of the O3 problem improves O3 smog recognized as an URBAN problem:Los Angeles, Haagen-Smit identifies chemical mechanism Smog considered REGIONAL problem; role of biogenic VOCs discovered A GLOBAL perspective: role of intercontinental transport, background Present 1980s 1950s AbatementStrategy: NMVOCs + NOx + CH4??
What is background O3 over the United States? Summer 1995 1- 5 p.m. Observations at Harvard Forest, MassachusettsData from Munger et al., [1996, 1998] Mean Afternoon O3 Background (ppbv)in GEOS-CHEM Model, Summer 1995 r2 = 0.74 U.S. Ozone Standard Intercept 30 ppb background (clean air) Ozone (ppbv) Range of background Estimated from observations Background is tagged as ozone produced outside the N. American boundary layer (surface-700 hPa) NOy-NOx (ppbv) (Index of Aged Pollution) Fiore et al., JGR, August, 2002.
QUESTION:Can we simultaneously mitigate air pollution and greenhouse warming? TOOL:GEOS-CHEM 3D Tropospheric Chemistry Model [Bey et al., 2001] (uses assimilated meteorology; 20 s; 4ºx5º or 2ºx2.5º horiz. resn.) MODEL EVALUATION: Mean July 1995 1-5 p.m. O3 (ppbv) in U.S. surface air Model Bias: 2 ppbv, r2 = 0.7 GEOS-CHEM captures: regional high-O3 episodes, observed O3vs. (NOy-NOx), observed tightening of O3 distribution from 1980 to 1995 [Fiore et al., JGR, August, 2002]
Impacts of future changes in global anthropogenic emissions on climate: Change in radiative forcing (W m-2) relative to 1995 base case NOx OH CH4 50% anthr. CH4 50% anthr. NMVOC 50% anthr. NOx 2030 A1 2030 B1
Change in summer afternoon O3 in surface air over the U.S. Relative to 1995 base year (mean 51 ppbv, background 23 ppbv) Mean O3 Background O3* Degradation of U.S. air quality from rise in global emissions despite domestic reductions Change in O3 (ppbv) 50% anthr. NMVOC 50% anthr. CH4 50% anthr. NOx 2030 A1 2030 B1 *produced outside the North American boundary layer (surface-700 hPa)
Impacts of future changes in global anthrop. emis. on U.S. air quality: Number of summer grid-square days with O3 > 80 ppbv Increase in U.S. pollution events despite domestic decline in anthrop. emissions 50% anthr. NOx 1995 (base) 50% anthr. VOC 50% anthr. CH4 2030 A1 2030 B1
Rising emissions from developing countries lengthen the O3 pollution season in the United States 1995 Base Case Degradation of U.S. air quality from rise in global emissions despite domestic reductions 2030 A1
NOx NMVOCs Double dividend of methane emissions reductions: (1) improve air quality everywhere (2) reduce greenhouse warming Free Troposphere CH4 emissions global impact: Lower background O3 Negative radiative forcing CH4 Intercontinental transport, global O3 background increases in 2030 A1 simulation O3 Boundary layer (0-2.5 km) NOx emissions local impact; little effect on climate Chemical loss Deposition NOx NMVOCs O3 O3 CONTINENT 1 CONTINENT 2 OCEAN