Download
1 / 18
200 likes | 500 Views
Overview of Demographic Dividend. Andrew Mason Demographic Dividend Working Group Barcelona, Spain June 5-8, 2013. First Demographic Dividend.

E N D
Overview of Demographic Dividend Andrew Mason Demographic Dividend Working Group Barcelona, Spain June 5-8, 2013
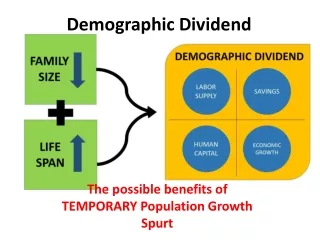
First Demographic Dividend At an early stage of [demographic] transition, fertility rates fall, leading to fewer young mouths to feed. During this period, the labor force temporarily grows more rapidly than the population dependent on it, freeing up resources for investment in economic development and family welfare. -- Lee and Mason (2006)
Second Demographic Dividend A second dividend is also possible. A population concentrated at older working ages and facing an extended period of retirement has a powerful incentive to accumulate assets—unless it is confident that its needs will be provided for by families or governments. -- Lee and Mason (2006)
Two Dividends Channel for first dividend: Increase in the support ratio (L/N) holding other factors, saving and income per effective worker, constant. Channel for second dividend: Changes in saving and capital per effective worker influence income, from labor and assets, per effective worker.
Support Ratio, China Andrew Mason, April 15, 2013
Support Ratio, China Net swing of 1.2% per year in per capita growth due to population age structure. Plus 0.8% per year Andrew Mason, April 15, 2013
Timing: First Dividend Phase Lower income
First Dividend – Annual growth per year in percent • Boost to economic growth varies from 0.2 to 0.9% per annum. • Biggest gains in E and SE Asia. • Small gains in countries with slow fertility decline.
First Dividend – Total gain in consumption per equivalent adult • Total gain ranges from under 5% to over 45%. • Small gains in West and some LAC countries. • Large gains in parts of Africa, LAC, and Asia.
Important issues about the first dividend • Annual gain versus total gain. • Timing – sooner better than later. • Largest gains may occur in countries which started from a particularly disadvantaged position, i.e., very high fertility and high child dependency. • Influence of policy on the dividend • Reproductive health and fertility decline • Lifecycle polices (labor income and consumption)
Second Demographic Dividend • Aging leads to an increase in the demand for lifecycle wealth, i.e., the aggregate resources required to meet lifecycle needs. • Impact on assets depends on extent to which elderly depend on transfers vs assets to support their old-age consumption. • Quantifying the second demographic dividend requires a macroeconomic model including • Impact of population on saving (s) and capital (K) • Effect of capital on productivity (Y/L)
Lifecycle wealth, high-income profiles • Modest increase in DMC W before 2000 – about 1.5% faster than labor income. • W grows most rapidly in DMCs from 2010-20 at 2.8% faster than labor income. • Growth becomes more moderate in later decades, but always faster than labor income. Mason and Lee 2011
Extending second dividend to human capital • Tradeoff between fertility and human capital spending per child. • Aging societies will have fewer workers but they will be more productive due to their enhanced human capital. • Quantification requires model with • Tradeoff between fertility and human capital • Impact of human capital on productivity
Bottom Line • The first and second demographic dividends can make an important contribution to economic growth. • The economic lifecycle influence both demographic dividends • Amounts consumed and produced at each age • Material needs in old age • Quantifying reallocation system essential to understanding how aging will influence the demand for assets to meet old-age needs.
References • Mason, A. (2005). Demographic Transition and Demographic Dividends in Developed and Developing Countries. United Nations Expert Group Meeting on Social and Economic Implications of Changing Population Age Structures, Mexico City. • Ronald Lee and Andrew Mason (2006) “What is the Demographic Dividend?” Finance & Development 43(3) September. http://www.imf.org/external/pubs/ft/fandd/2006/09/basics.htm • Mason, A. and R. Lee (2007). Transfers, Capital, and Consumption over the Demographic Transition. Population Aging, Intergenerational Transfers and the Macroeconomy. R. Clark, A. Mason and N. Ogawa, Elgar Press: 128-162. • Mason, A. and S.-H. Lee (2011). Population, Wealth, and Economic Growth in Asia and the Pacific. Aging, Economic Growth, and Old-age Security in Asia. D. Park, S.-H. Lee and A. Mason. Cheltenham, UK and Northamption, MA, Edward Elgar: 32-82. • Lee, R. and A. Mason (2010). "Fertility, Human Capital, and Economic Growth over the Demographic Transition." European Journal of Population 26(2): 159-182.