Download
1 / 26
260 likes | 420 Views
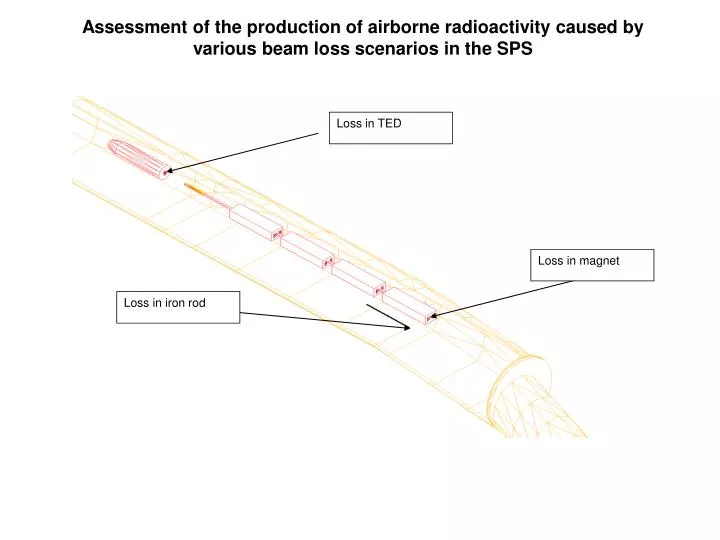
Loss in TED. Loss in magnet. Loss in iron rod. Assessment of the production of airborne radioactivity caused by various beam loss scenarios in the SPS. Table: Production of the airborne radioactivity (in Bq, no decay considered) per lost proton.

E N D
Loss in TED Loss in magnet Loss in iron rod Assessment of the production of airborne radioactivity caused by various beam loss scenarios in the SPS
Table: Production of the airborne radioactivity (in Bq, no decay considered) per lost proton. Dose in Sv given to the critical group at TT20 per lost proton Dose in uSv given to the critical group normalized to 1.66E19 protons in case air is continuously released All Sv/Bq factors calculated by P. Vojtyla
Relative comparison of the dose to public given by the different beam loss scenarios calculated for a time span between production and release of 0 s.
Dose per lost proton (450 GeV/c) which is given to the critical group as a function of the time span between the production of the isotopes and their release. Minimum time required between nuclei production and air release to reduce dose to public to 10 uSv in case of a continuous air release.
Accidental release of air over 1 day of operation (1E17 protons) Same Bq production rates for iron rod per proton but short term Bq-to-Sv release factors are considered to calculate dose The critical group of the public will get a dose of 18.6 uSv in case a decay time of 0 seconds is assumed. For a decay time of 300 s the dose to the critical group will go down 8.3 uSv. In order to lower the risk of an unnecessary release of radioactive air to the environment, the emergency air release option of the system should be blockedduring beam-on periods. Functioning of ventilation system (e.g.: electricity supply) should be only possible when interlock of extraction is activated. if (beam interlock == true) {electricity to emergency system} if (beam interlock == false) {no electricity to emergency system)
Further analysis of composition of radioactive air Table: Dose to public (Sv) per lost proton calculated for the three loss scenarios at 450 GeV/c. The time between the production of the radioactive isotopes and their release is assumed to be of 0 s. Isotopes which contribute more than 5 % to the total dose received by the critical group are highlighted in the table.
Summary of all isotopes contributing more than 5 % to the total dose seen given to the critical group of the public Key elements contributing dose to public Be-7, C-11, N-13, O-14, O-15, Al-28, P-35, Cl-39 and Ar-41. Measurement system which is used to measures air release must be reliable in measuring these key elements
Measurement system used to measure air releases at the SPS Differential Ionization chamber system • Two chambers of same type: • one chamber is flooded with fresh air • the second chamber with air whose activity has to be measured • Difference gives the result of activity produced Calibration factor used: 1.565E-18 A/(Bq/m3) Reliability of calibration factor unknown Simulation of chamber response is required to check calibration factor
Simulation of differential chamber • Chamber is filled with air • List of radioactive isotopes is provided with its contribution to the total activity • Isotope is chosen randomly according to their contribution • Starting position is chosen homogeneously in the air volume (randomly) • Energy deposition is calculated within the air volume of the active part of the chamber • Conversion into e-/Ion+ pairs produced current (A) per Bq • calculated calibration factor in A/(Bq/m3).
Results for single isotopes Reliability of simulation: ???? For elements where we have information from the manufacturer the simulation results agree within 20 %.
Comparison between the simulated (“real”) calibration factor of the given isotopes and the calibration factor of 1,57E-18 A/(Bq/m3) which is currently used to determine the air activity released. } Strongly underestimated Overestimated by used calibration factor Be-7, which emits only a gamma is strongly underestimated by used calibration factor
Simulated (“real”) calibration factors of the isotope mixtures calculated for five beam loss situations. The resulting calibration factors are compared to the used measurement calibration factor of 1.57E-18 A/(Bq/m3). Measurement of the isotope mixture overestimates the Bq released by at least 30 %
Sv/Bq calibration factor applied to measured Bq For Air releases in Switzerland: 3.4E-19 Sv/Bq Obtained byP. Vojtylafactors are conservative For Air releases in France: 5.5E-19 Sv/Bq Check whether used factors of 5.5E-19 Sv/Bq if conservative for TT20 Calculation of Sv/Bq factor for the given long term release example of TT20 Used Sv/Bq factor at TT20 is conservative for all scenarios
For the aforementioned situations the used chamber calibration factor A/(Bq/m3) is conservative + The Sv/Bq factor is conservative (only proven at TT20) Measurement results can be seen as conservative approach to the real dose given to critical group of the public Air release measurement results of 2004 will be used to extrapolate air releases for the future SPS operation
Determination of the correlation between radioactivity released and the intensity of high-energy particles in the SPSin 2004 Data are based on: Airborne radioactivity: Differential chamber read-out (background corrected) Beam intensities: \\cern.ch\dfs\Divisions\SL\DIV_SL\STAT\SPSSTAT\PROTONS\2004\Tab\Stats Protons 2004.xls and Intensity of High-energy beam on dump between July and September: Joerg Wenninger
Back test of calculated factors for TT10 releases Factors are based on data between July and September Calculated result for whole year versus measured result for whole year 0.5 uSv (dump) + 1.12 uSv (others) =1.62 uSv (total) 1.54 uSv (measured by chambers)
Intensities used for extrapolations to 2006 and later Results based on pure extrapolations from 2004 to 2006 and later
More accurate calculations to obtain dose to public Main additional factors considered • TT10 releases: • additional losses at low energies during CNGS operation (see Tables in our report) • fixed target operation (extraction at Point 2) causes higher releases at TT10 than CNGS operation • TT60 releases: • slow extraction at Point 6 is replaced by fast extraction to LHC • Point 3 and Point 5: • additional releases caused by fast extraction at Point 4
Water activation Water activation released in 2004 caused 50 nSv to critical group of the public Main water activation in 2004 came from TDC2/TCC2 Conservative assumption: water activation scales with the intensity of the SPS (factor 5) Dose in 2006 and later given to critical group of the public by water release: 250 nSv/year
Sextant 1 Sextant 2 Sextant 3 Sextant 4 Sextant 5 Sextant 6 Activation in the SPS Remnant dose rate 30 h after the beginning of the shutdown in 2004.
Dose caused mainly by high-energy dump operation 2004: 1E18 high-energy particles on dump Long term dose rate after 6 month at hottest monitor position (TIDV): 2 mSv/h 2006: 1.2E18 high energy particles on dump Long term dose rate after 6 month at hottest monitor position: < 3 mSv/h
Point 2 Extraction to North Area Due to different operation scheme Compared to Point 1 much lower remnant dose rate after beam off.
Long term dose rate in Point 2 2004: 8.8E18 high-energy particles extracted Long term dose rate after 6 month at hottest monitor position (ZS): 1.2 mSv/h 2006 and later: 1.6E19 high-energy particles extracted: dose rate will double at the extraction equipment
Long term dose rate in Point 6 Dose rate at the extraction equipment after six month of cooling will be much lower ( ~ factor 50) than the one seen during slow extraction New loss point at Point 4 Comparison between losses at Point 2 (2004) and Point 4 Point 2 Point4 Losses 4.3% below 0.5% Number of protons extracted 8.8E18 4.5E19 Lost protons 3.8E17 2.3E17 Remnant dose in Point 4 will be lower than the one in Point 2 in 2004(similar equipment assumed)