Download
1 / 10
100 likes | 106 Views
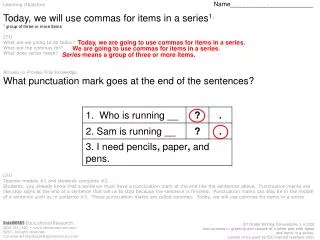
Learning Objective Name________________________ Today, we will solve 1 addition problems using a picture graph. 1 find the answer CFU What are we going to do today? What are we going to solve? What does solve mean? Activate (or provide) Prior Knowledge. Nickel.

E N D
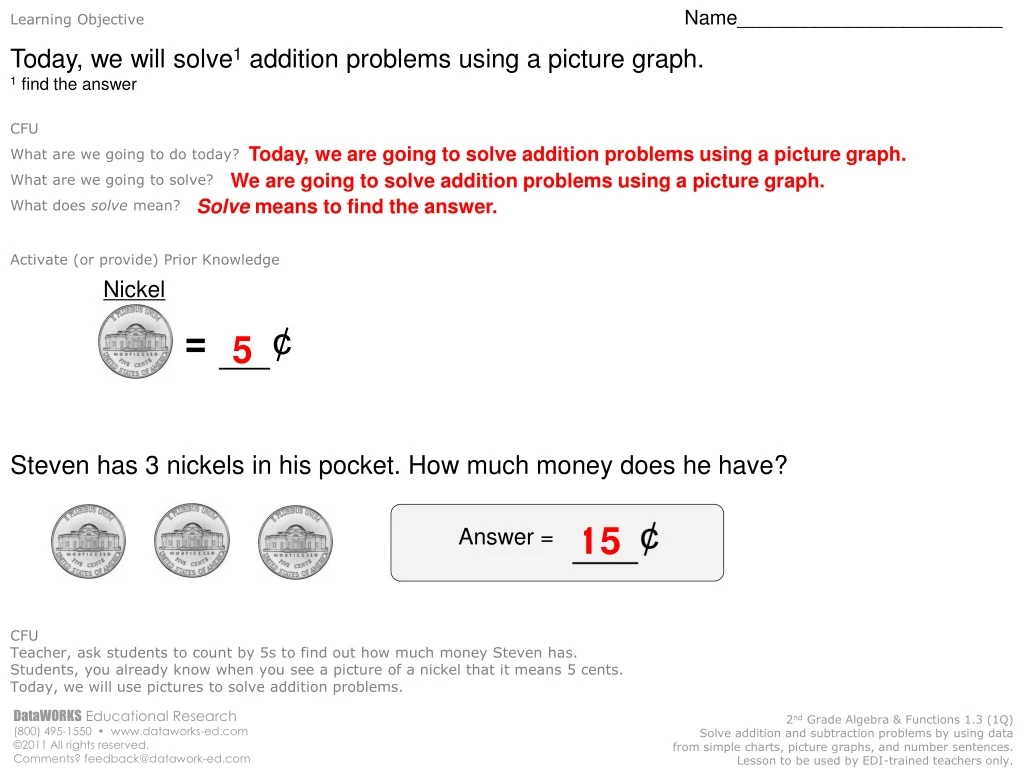
Learning Objective Name________________________ Today, we will solve1 addition problems using a picture graph. 1 find the answer CFU What are we going to do today? What are we going to solve? What does solve mean? Activate (or provide) Prior Knowledge Nickel Answer = Today, we are going to solve addition problems using a picture graph. We are going to solve addition problems using a picture graph. Solve means to find the answer. Steven has 3 nickels in his pocket. How much money does he have? CFU Teacher, ask students to count by 5s to find out how much money Steven has. Students, you already know when you see a picture of a nickel that it means 5 cents. Today, we will use pictures to solve addition problems. 2nd Grade Algebra & Functions 1.3 (1Q) Solve addition and subtraction problems by using data from simple charts, picture graphs, and number sentences. Lesson to be used by EDI-trained teachers only.
Concept Development 30 cents + 20 cents 50 cents • A picture graph is a way to organize2 information. • A picture graph uses a pictureto stand for a number value. • Addition means to put together. • The symbol3 for addition is the plus sign (+). 2 keep track of 3 a sign used to stand for something Example: Picture Graph The picture stands for the number value 10 Money in a Piggy Bank Each = 10¢ Steven has 30 cents. Steven Juan has 20 cents. Juan Altogether, Steven and Juan have 50 cents. CFU B. At the beach, Luis saw 4 seals and Ann saw 6 seals. Which of these picture graphs shows the number of seals they saw? How do you know? A. Which number phrase shows how many strawberries Katrina and Miguel ate altogether? How do you know? A. 5 + 5 + 5 Each = 5 strawberries B. 5 – 5 – 5 In your own words, what is a picture graph? A picture graph is _____. Katrina Miguel 2nd Grade Algebra & Functions 1.3 (1Q) Solve addition and subtraction problems by using data from simple charts, picture graphs, and number sentences. Lesson to be used by EDI-trained teachers only.
Skill Development/Guided Practice Name______________________________ A picture graph is a way to organize information. Addition means to put together. Solve addition problems using picture graphs. Apples Picked Each = 5 apples Books Read Each = 2 books 2 2 2 5 5 5 Brenda Andre 2 2 2 2 5 5 Moe Jane How many apples did Brenda and Moe pick altogether? How many books did Andre and Jane read altogether? 25 14 + + = + + + + = + + + + Altogether, Andre and Jane read 14 books. Altogether, Brenda and Moe picked 25 apples. CFU How did I know what to circle? Why did I write the number value above each picture? How did I answer the question? How did you know what to circle? Why did you write the number value above each picture? How did you answer the question? 2nd Grade Algebra & Functions 1.3 (1Q) Solve addition and subtraction problems by using data from simple charts, picture graphs, and number sentences. Lesson to be used by EDI-trained teachers only.
Skill Development/Guided Practice (continued) Name______________________________ A picture graph is a way to organize information. Addition means to put together. Solve addition problems using picture graphs. Rainy Days Each = 4 Rainy Days Hot Dogs Eaten Each = 10 Hot Dogs 10 10 10 4 4 4 4 10 10 April Friday 10 4 4 4 May Saturday 4 4 4 4 10 10 10 10 June Sunday How many rainy days were there in May and June altogether? How many hot dogs were eaten Saturday and Sunday altogether? 4 4 4 4 4 4 4 28 = + + + + + + 10 10 10 10 10 50 = + + + + Altogether, there were 28 rainy days in May and June. Altogether, 50 hot dogs were eaten Saturday and Sunday. CFU How did I know what to circle? Why did I write the number value above each picture? How did I answer the question? How did you know what to circle? Why did you write the number value above each picture? How did you answer the question? 2nd Grade Algebra & Functions 1.3 (1Q) Solve addition and subtraction problems by using data from simple charts, picture graphs, and number sentences. Lesson to be used by EDI-trained teachers only.
Importance A picture graph is a way to organize information. Addition means to put together. 1. Solving addition problems using a picture graph will help you understand charts and graphs in magazines. Which movie was the most popular among children and how many children watched that movie? Each = 10 children 50 children watched SPLATTER! 2. Solving addition problems using a picture graph will help you do well on tests. CFU Does anyone else have another reason why it is important to solve addition problems using a picture graph? (pair-share) Why is it important to solve addition problems using a picture graph? You may give me one of my reasons or one of your own. Which reason means more to you? Why? 2nd Grade Algebra & Functions 1.3 (1Q) Solve addition and subtraction problems by using data from simple charts, picture graphs, and number sentences. Lesson to be used by EDI-trained teachers only.
1. 2. Cars Sold Each = 2 Cars Sold Shells Found on the Beach Each = 5 Shells 2 2 Sam 5 5 5 2 2 2 2 Norma Jasmine 5 2 2 2 Billy Carlos How many shells did Norma and Billy find altogether? How many cars did Jasmine and Carlos sell altogether? 5 5 5 5 14 + 2 2 2 2 2 2 2 + + + + = + = + + + 20 Altogether, Jasmine and Carlos sold 14 cars. Altogether, Norma and Billy found 20 shells. 2nd Grade Algebra & Functions 1.3 (1Q) Solve addition and subtraction problems by using data from simple charts, picture graphs, and number sentences. Lesson to be used by EDI-trained teachers only.
Independent Practice Name______________________________ A picture graph is a way to organize information. Addition means to put together. Solve addition problems using picture graphs. Basketball Players in a Gym Each = 5 Basketball Players Flights to Cities Each = 2 flights 5 5 5 5 5 Sunday 2 2 2 5 5 Miami Monday 2 2 2 5 5 5 5 Dallas Tuesday How many basketball players were in the gym Monday and Tuesday altogether? How many flights are there to Miami and Dallas altogether? 5 5 5 5 5 5 + + + + = + 30 2 2 2 2 2 2 + + + + = 12 + Altogether, there are 12 flights to Miami and Dallas. Altogether, there were 30 basketball players at the gym Monday and Tuesday. 2nd Grade Algebra & Functions 1.3 (1Q) Solve addition and subtraction problems by using data from simple charts, picture graphs, and number sentences. Lesson to be used by EDI-trained teachers only.
Periodic Review 1 Name______________________________ A picture graph is a way to organize information. Addition means to put together. Solve addition problems using picture graphs. Bees in a Garden Each = 2 Bees Tennis Players in the Park Each = 4 Tennis Players 2 2 2 2 Morning 4 4 4 4 2 2 2 Women Afternoon 4 4 2 Men Night How many bees were in the garden in the morning and afternoon altogether? How many tennis players are in the park altogether? 2 2 2 2 2 2 2 + + + + + = + 14 4 4 4 4 4 4 + + + + = 24 + Altogether, there were 24 tennis players in the park. Altogether, there were 14 bees in the garden in the morning and afternoon. 2nd Grade Algebra & Functions 1.3 (1Q) Solve addition and subtraction problems by using data from simple charts, picture graphs, and number sentences. Lesson to be used by EDI-trained teachers only.
Periodic Review 2 Name______________________________ A picture graph is a way to organize information. Addition means to put together. Solve addition problems using picture graphs. Friends with Chocolate Each = 10 Pieces of Chocolate Ducks in a Pond Each = 5 Ducks 10 James 5 5 10 10 10 Morning Lauren 5 5 5 5 10 10 Evening Casey How many pieces of chocolate do James and Lauren have altogether? How many ducks were in the pond altogether? 10 10 10 10 + + = + 40 5 5 5 5 5 5 + + + + = 30 + Altogether, there were 30 ducks in the pond. Altogether, James and Lauren have 40 pieces of chocolate. 2nd Grade Algebra & Functions 1.3 (1Q) Solve addition and subtraction problems by using data from simple charts, picture graphs, and number sentences. Lesson to be used by EDI-trained teachers only.
Periodic Review 3 Name______________________________ A picture graph is a way to organize information. Addition means to put together. Solve addition problems using picture graphs. Towns that Recycle Each = 4 Families Who Recycle Restaurant Meals Served Each = 10 Meals Served 4 4 4 Lilly City 10 10 10 4 4 Lunch Eastville 10 10 4 4 4 San Pablo Dinner How many families in Lilly City, Eastville, and San Pablo recycle altogether? How many meals did the restaurant serve altogether? 32 4 4 4 + 4 4 + 4 4 4 + + + + + = 10 10 10 + 10 10 + + = 50 + Altogether, the restaurant served 50 meals. Altogether, 32 families in Lilly City, Eastville, and San Pablo recycle. 2nd Grade Algebra & Functions 1.3 (1Q) Solve addition and subtraction problems by using data from simple charts, picture graphs, and number sentences. Lesson to be used by EDI-trained teachers only.