Download
1 / 49
510 likes | 700 Views
Chem(o)informatics exploration of the entire biological data continuum for building predictive chemical toxicity models. Alexander Tropsha Carolina Center for Computational Toxicology Carolina Center for Environmental Bioinformatics and Laboratory for Molecular Modeling

E N D
Chem(o)informatics exploration of the entire biological data continuum for building predictive chemical toxicity models Alexander Tropsha Carolina Center for Computational Toxicology Carolina Center for Environmental Bioinformatics and Laboratory for Molecular Modeling Eshelman School of Pharmacy, UNC-Chapel Hill
Who is Tim CLARK(s)? HAPPY BIRTHDAY(s), TIM!!!
Outline (briefly) Semantics and computational chemistry [chem(o)informatics at the model(l)ing conference] (briefly) Predictive QSAR Modeling Workflow Applications In vivo toxicity prediction using hybrid chemical biological descriptors novel data partitioning approach based on in vitro – in vivo correlations: Hierarchical QSAR modeling of rodent toxicity preliminary analysis of ToxCAST data Modeling of ToxRefDB endpoints using chemical descriptors only Modeling selected in vivo end points using hierarchical QSAR modeling
Our fascination with “O” inCHEM[O]INFORMATICS • Subject of passionate discussions among the Board of Cheminformatics and QSAR Society for nearly 3 months in 2006 • Personal bias: Cheminformatics because it is 6.6666% shorter • Recent lecture title submitted to the 2007 Goslar conference: Cheminformatics Manifesto • As printed: ChemOinformatics Manifesto
Common misbelief about the origin of chemoinformatics …is that the term “chemoinformatics” was introduced in the Annual Reports of Medicinal Chemistry in 1998 by F. Brown: “The use of information technology and management has become a critical part of the drug discovery process. Chemoinformatics is the mixing of those information resources to transform data into information and information into knowledge for the intended purpose of making better decisions faster in the area of drug lead identification and organization”
A spectre is haunting Europe -- the spectre of [chemoinformatics]. [Chemoinformatics] is already acknowledged by all European powers to be itself a power. It is high time that [Chemoinformaticians] should openly, in the face of the whole world, publish their views, their aims, their tendencies, and meet this nursery tale of the spectre of [chemoinformatics] with a manifesto of the party itself.
increasing complexity increasing uncertainty SAR structure-activity relationships increasing relevance to RA Chemocentric view of biological data Toxicity Risk Assessment Slide courtesy of Dr. Ann Richard (EPA)
Chemical Structure – in vitro – in vivo Toxicity Data Continuum. Toxicity testing Human health risk Slide is courtesy of Dr. Ivan Rusyn (UNC)
Principles of QSAR/QSPR modeling D E S C R I P T O R S Quantitative Structure Property Relationships C O M P O U N D S 0.613 0.380 -0.222 0.708 1.146 0.491 0.301 0.141 0.956 0.256 0.799 1.195 1.005 P R O P E R T Y
Predictive QSAR Workflow* Y-Randomization Multiple Training Sets Combi-QSPR Modeling Split into Training, Test, and External Validation Sets Original Dataset Only accept models that have a q2 > 0.6 R2 > 0.6, etc. Experimental Validation of Prioritized Alerts Multiple Test Sets Activity Prediction Prediction of Potential Safety Alerts to Prioritize for Testing External validation Using Applicability Domain (AD) Validated Predictive Models with High Internal & External Accuracy *Tropsha, A.,* Golbraikh, A. Predictive QSAR Modeling Workflow, Model Applicability Domains, and Virtual Screening. Curr. Pharm. Des., 2007, 13, 3494-3504.
Compound prioritization using the ensemble of QSAR models Database QSAR models Alerts Non-toxic Inactive
Applications Study I:The Use of High Throughput Screening Data as Additional Biological Descriptors Improves the Prediction Accuracy of Conventional QSAR Models of Chemical Carcinogenicity* Zhu et al, EHP, 2008, (116): 506-513
Cell viability HTS data for 1,289 Organic Compounds* *Xia et al, EHP, 2008, 116 (3), 284-291
Additional in vivo data on 1,289 Compounds NTPBSI: National Toxicology Program Chemical Structure Index file NTPGTZ: National Toxicology Program genotoxicity HPVCSI: High Production Volume Chemicals CPDB: Carcinogenic Potency Data Base All Species IRISSI: EPA Integrated Risk Information System The table is based on the DSSTox project of Dr. Ann Richard at EPA.
The Relationship between HTS Results and Rodent Carcinogenicity
Predictive Power of QSAR Models using Conventional Chemical Descriptors.
Principle of QSAR/QSPR modeling Quantitative Structure Property Relationships Introduction B I O P R O F I L E S + C O M P O U N D S 0.613 0.380 -0.222 0.708 1.146 0.491 0.301 0.141 0.956 0.256 0.799 1.195 1.005 P R O P E R T Y D E S C R I P T O R S
Comparison between Predictive Power of QSAR Models using Conventional vs. Hybrid Descriptors.
Conclusions of the Study I • NTP-HTS screening data have limited predictive power for rodent carcinogenicity. • Using the NTP-HTS data as biological fingerprint descriptors significantly improved the overall QSAR-based prediction accuracy of rodent carcinogenicity. • Thus, models built with the hybrid chemical/biological descriptors may be ultimately helpful in prioritizing or partially replacing in vivo toxicity testing
Applications Study II:A Two-step Hierarchical QSAR Modeling Workflow for Predicting in vivo Chemical Toxicity* *Zhu, Rusyn, Wright, et al, EHP, 2009, 2009, 117(8):1257-64
ZEBET Database* and Data Preparation cytotoxicity IC50 and both rat and/or mouse LD50 361 compounds inorganics, mixtures and heavy metal salts are removed 291 compounds both in vitro IC50 values and rat LD50 results 253 compounds Random split *The ZEBET database was provided by Dr. Ann Richard (EPA) 23 compounds validation set 230 compounds modeling set
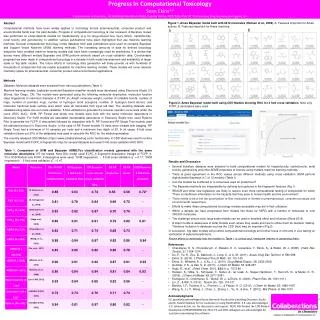
(Rather) poor in vitro-in vivo Correlation Between IC50 and Rat LD50 Values R2=0.46
Data partitioning based on the moving regression approach IC50 vs. rat LD50 values R2=0.74 for Class 1 compounds
Modeling Workflow 253 compounds with IC50 and LD50 results 137 C1 compounds 642 kNN LD50 models Split into two sets based on the baseline between IC50 and LD50 230 compound modeling set 517 kNN classification models 40 kNN LD50 models 93 C2 compounds 23 external compounds
Prediction Workflow Predict LD50 values based on 642 kNN LD50 models Class 1 compounds Classification based on 517 kNN models Test set Predict LD50 values based on 40 kNN LD50 models Class 2 compounds Final prediction
Classification of the Rat LD50 Values for the External Set of 23 Compounds No AD: Classification rate = 62% With AD: Classification rate = 78%
Prediction of the Rat LD50 Values of the External 23 Compounds R2=0.79, MAE=0.37, Coverage=74% (17 out of 23)
Application Study IIIPreliminary analysis of ToxCAST data using the hierarchical QSAR modeling approach
ToxCastTM Background • Research program of EPA’s National Center for Computational Toxicology (NCCT) • Addresses chemical screening and prioritization needs for pesticidal inerts, anti-microbials, CCLs, HPVs and MPVs • Comprehensive use of HTS technologies to generate biological fingerprints and predictive signatures • Coordinated with NTP and NHGRI/NCGC via Tox21 • Committed to stakeholder involvement and public release of data • Communities of Practice- Chemical Prioritization; Exposure • NCCT website http://www.epa.gov/ncct/toxcast • ACToR http://www.epa.gov/actor/ • ToxRef DB http://www.epa.gov/ncct/toxrefdb/ • DSSTox (PubChem) http://www.epa.gov/ncct/dsstox/ Slide courtesy of Dr. Ann Richard, EPA
ToxRefDB: >$1Billion Million Dollars Worth of In Vivo Chronic/Cancer Bioassay Effects and Endpoints Effects & Endpoints ToxCast Phase I Chemicals • Chemical/Study-centric • Detailed toxicity data • Toxicity standards/Data model • Exportable • Compatible with multiple platforms • (ACCESS, xml, MySQL) http://www.epa.gov/ncct/toxrefdb/ Slide courtesy of Dr. Ann Richard, EPA
Comparison of the ToxCAST in vitro Assay Results for Duplicates/Triplicates *
Relationships Between in vivo and in vitro Assays in ToxCastTM (based on Matthew’s Correlation Coefficient, MCC*) * 75 (49+26) in vivo and 409 in vitro endpoints
Data Curation In-vitro assays: 524 353 Remove one of two highly correlated (R2 >0.95) assays and low-variance (<4 non-zero entries) assays Chemicals: 320 228 duplicate structures, mixtures, inorganic compounds, macromolecules were removed Kept only those for which in-vivo data is available (i.e. chronic mouse toxicity)
Toxcast Data Prediction • Fifty Endpoints are selected based on the rank of their frequencies • Total of 1899 predictors from various tables • Eight classification methods for prediction, 84 total models • Discriminant analysis (DA) • Distance Scoring (DS) • K-Nearest Neighbor (KNN) • - General linear model selection (GLM) • - Logistic regression (LR) • - Partial least square (PLS) • - Partition tree (PT) • Radial basis machine (RBM) • 5-fold cross-validation, 10 iterations, performance metrics: • - AUC • - Accuracy • - RMSE Slide courtesy of Dr. Russ Wolfinger, SAS
Prediction Comparison Based on Ave (Sensitivity + Specificity) Chemical Descriptors only Bioassay Data only CHR_Mouse_LiverTumors CHR_Rat_LiverTumors CHR_Rat_Tumorigen CHR_Mouse_Tumorigen Combine both Chemical Descriptors & Bioassay Data CHR_Rat_CholinesteraseInhibition CHR_Rat_LiverTumors CHR_Mouse_LiverTumors CHR_Mouse_Tumorigen DEV_Rabbit_Skeletal_Cranial DEV_Rat_Urogenital_Renal MGR_Rat_Fertility CHR_Rat_Tumorigen MGR_Rat_Kidney Slide courtesy of Dr. Russ Wolfinger, SAS
Conventional QSAR Modeling Breiman L. Machine Learning 45 (2001): 5-32 • Uisng chemical descriptors only: -1224 Dragon chemical descriptors - Random Forest (RF) approach
In vivo toxicity prediction using either biological or hybrid (chemical plus biological descriptors) Using ToxCAST bioassay results as biological descriptors did not result in any statistical significant models. The use of either only chemical or hybrid (biological + chemical descriptors) improved the results somewhat.
Focusing on a small subset of data: Chronic Mouse Toxicity • Continuity (overlaps with previous ToxRefDB data) • Manageable (has only 7in-vivo assays) • 3 assays with the highest fraction of actives chosen for initial studies: CHR_Mouse_LiverProliferativeLesions (87 actives) CHR_Mouse_LiverTumors (68 actives) CHR_Mouse_Tumorigen (88 actives)
Data partitioning based on in vitro-in vivo correlations as part of the QSAR Modeling workflow For each In-vitro vs. In-vivo profile (3 x 353 = 1059 combinations): In-vivo Toxic metabolites, systemic effects Baseline Class 2 Class 2 Class 1 Class 1 ToxCast friendly 0 1 In-vivo Offendors Baseline Metabolic detoxification, poor ADME In-vitro 0 1 In-vitro Binary classification QSAR for “baseline” (II & III) vs. off-line (I & IV) using chemical descriptors only
Modeling Workflow for each of the 1059 in vitro – in vivo series using RF and Dragon descriptors Toxic metabol, systemic effects Baseline In-vivo Class 2 Class 2 Class 1 Class 1 Baseline Metabolic detoxification, poor ADME in vitro Tranining sets (147cmpd) Modeling sets (183 cmpd) a a a A a a A A A A b B b b B b B b B B c c C c c C C C C c d D D d d D D d d D E e e e E e E E E Evaluation sets (55 cmpd) e Test sets (36 cmpd) 228 chemicals 1224 chemical descriptors 3 in-vivo endpoints 353 in-vitro assays
External prediction workflow Validated RF QSAR classifiers (based selected assays Toxic or Non-toxic in vivo Prediction Toxic or Non-toxic in vivo in one assay Toxic or Non-toxic in vivo in one assay Toxic or Non-toxic in vivo in one assay Individual Prediction for in vivo endpoint 0 1 In vivo Consensus Prediction Toxic or non-toxic? 0 1 In vitro Toxic metabolites, systemic effects Baseline Class 2 Class 2 Class 1 Class 1 Metabolic detoxification, poor ADME Baseline Class 1 or 2 In vitro Assay Database
Top ToxCAST Bioassays (selected based on the mean of the 5-Fold External Cross-validation CCR) For mouse liver proliferative lesions:
Consensus Modeling by Using the Top ToxCAST Bioassays for each in vivo Toxicity Endpoint 353 ToxCAST bioassays were ranked based on the average CCR of the 5 fold external validation for each in vivo end point The top 10-30 bioassays (judged by CCR) were selected to develop the consensus model.
The Consensus Prediction Generally Improves the Predictivity of QSAR Models
Conclusions • Focus on accurate prediction of external datasets is much more critical than accurate fitting of existing data: validate, then interpret! • validation!!! • applicability domain • consensus prediction using all acceptable models • Ideally, experimental validation of a small number of computational hits • Outcome: decision support tools in selecting future experimental screening sets • HTS and –omics data may be insufficient to achieve the desired accuracy of the end point property prediction BUT should be explored as biodescriptors in combination with chemical descriptors • New computational approaches (e.g., hierarchical QSAR) • Understanding of both chemistry and biology • Integration of cheminformatcs and bioinformatics: interpretation of significant descriptors in terms of pathways between Molecular Initiating Events (MIE) and Adverse Effects Outcome (AOE) (T. Schultz and OECD QSAR Toolbox paradigm)
Acknowledgements Collaborators: UNC: I. Rusyn, F. Wright EPA: T. Martin, D. Young A. Richard, R. Judson, D. Dix, R. Kavlock Principal InvestigatorAlexander Tropsha Research ProfessorsClark Jeffries, Alexander Golbraikh, Hao Zhu, Simon Wang Graduate Research AssistantsChristopher Grulke, Nancy Baker, Kun Wang, Hao Tang, Jui-Hua Hsieh, Rima Hajjo, Tanarat Kietsakorn, Tong Ying Wu, Liying Zhang, Melody Luo, Guiyu Zhao, Andrew Fant, Stephen Bush Postdoctoral Fellows Georgiy Abramochkin, Denis Fourches Visiting ResearchScientistAleks Sedykh, Eugene Muratov MAJOR FUNDINGNIH - P20-HG003898 (RoadMap) - R21GM076059 (RoadMap) - R01-GM66940 - R01-GM068665 EPA (STAR awards) - RD832720 - RD833825 Research ProgrammerTheo Walker System AdministratorMihir Shah Adjunct MembersWeifan Zheng, Shubin Liu