Download
1 / 26
270 likes | 409 Views
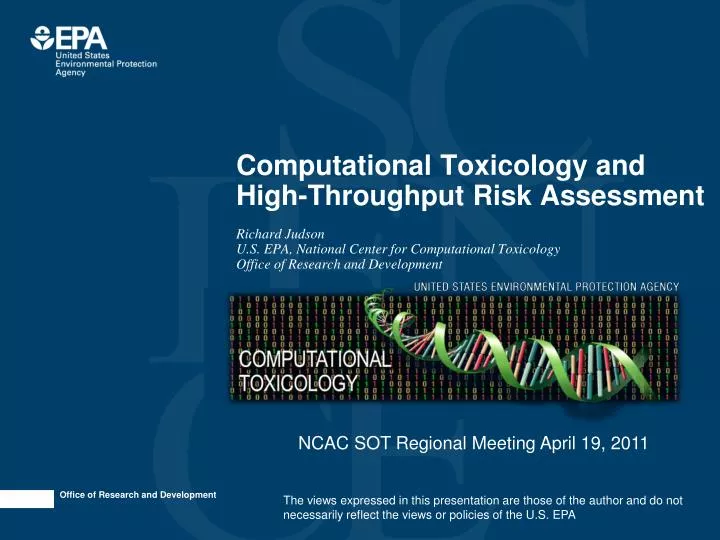
Computational Toxicology and High-Throughput Risk Assessment. Richard Judson U.S. EPA, National Center for Computational Toxicology Office of Research and Development. NCAC SOT Regional Meeting April 19, 2011.

E N D
Computational Toxicology and High-Throughput Risk Assessment Richard Judson U.S. EPA, National Center for Computational Toxicology Office of Research and Development NCAC SOT Regional Meeting April 19, 2011 The views expressed in this presentation are those of the author and do not necessarily reflect the views or policies of the U.S. EPA
EPA CompTox Research Benefits -Less expensive -More chemical -Fewer animals -Solution Oriented Thousand chemicals ToxCasttesting Bioinformatics/ Machine Learning -Innovative -Multi-disciplinary -Collaborative -Transparent Chemical Toxicity Profile
Model ToxCast Application HTRA Report Card For Chemical: ABC Population Variability Pathway / Target / Model CAR/PXR Pathway ER / AR / Endocrine Targets ReproTox Signature DevTox Signature Vascular Disruption Signature Thyroid Cancer Signature Uncertainty BPADL Critical Effect No detect BPAD Distribution No detect No detect Low High Exposure / Dose Upper no effect dose
Model ToxCast Application:High-Throughput Risk Assessment (HTRA) • Using HTS data for initial, rough risk assessment of data poor chemicals • Risk assessment approach • Estimate upper dose that is still protective • In HTRA: BPAD (Biological Pathway Altering Dose) • Analogous to RfD, BMD • Compare to estimated steady state exposure levels • Contributions of high-throughput methods • Focus on molecular pathways whose perturbation can lead to adversity • Screen 100s to 1000s of chemicals in HTS assays for those pathways • Estimate oral dose using High-Throughput pharmacokinetic modeling • Incorporate population variability and uncertainty
HTRA Outline Identify biological pathways linked to adverse effects Measure Biological Pathway Altering Concentration (BPAC) in vitro (ToxCast) Estimate in vivo Biological Pathway Altering Dose (BPAD) (PK modeling) Incorporate uncertainty and population variability estimates Calculate BPAD lower limit – Estimated health protective exposure limit
Example concentration-response curves Sample curves for BPA in two ER assays Note that full concentration-response profiles can be measured, at arbitrary spacing and to arbitrarily low concentrations (at moderate cost for a given chemical)
Experimental Assays for Characterizing Steady-State Pharmacokinetics Human Hepatocytes (10 donor pool) Add Chemical (1 and 10 mM) Remove Aliquots at 15, 30, 60, 120 min Analytical Chemistry Hepatic Clearance Plasma Protein Binding Human Plasma (6 donor pool) Add Chemical (1 and 10 mM) Analytical Chemistry Equilibrium Dialysis Combine experimental data with PK Model to estimate dose-to-concentration scaling “Reverse Toxicokinetics” In collaboration with Hamner Institutes / Rusty Thomas
BPAD Probability Distribution • BPAD = BPAC / Css / DR • BPAC and Css / DR ~ log-normal • BPAC: lowest AC50 for pathway assays • Estimate protective BPAD as the lower 99% tail (BPAD99) • Add in uncertainty and take the lower 95% bound on BPAD99 to give a more protective lower bound • BPADL99 (“L” for lower) Population Variability Uncertainty BPADL BPAD Distribution
Combining in vitro activity and dosimetry Range of in vitro AC50 values converted to humanin vivo daily dose Triclosan Pyrithiobac-sodium log (mg/kg/day) Safety margin Actual Exposure (est. max.) Rotroff, et al. Tox.Sci 2010
Conazoles and Liver Hypertrophy • Conazoles are known to cause liver hypertrophy and other liver pathologies • Believed to be due (at least in part) to interactions with the CAR/PXR pathway • ToxCast has measured many relevant assays • Calculate BPADL for 14 conazoles • Compare with liver hypertrophy NEL/100
Conazole / CAR/PXR results BPADRange Population Variability Uncertainty BPADL BPAD Distribution Exposure estimate NEL/100 LEL, NEL
Conazole Summary • Rough quantitative agreement • Significant BPADL vs. NEL/100 rank correlation (p=0.025) • 12 of 14 chemicals have BPADL within 10 of NEL/100 • For only 3 is BPADL significantly less protective than NEL/100 • All BPADL > Exposure estimate • Some apples to oranges: human BPADL, rat NEL • Rat RTK underway for some of these chemicals
HTRA Summary • Select toxicity-related pathways • Develop assays to probe them • Estimate concentration at which pathway is “altered” (PD) • Estimate in vitro to in vivo PK scaling • Estimate PK and PD uncertainty and variability • Combine to get BPAD distribution and health protective exposure limit estimate (BPADL) • Many (better) variants can be developed for each step (1-6) • Use for analysis and prioritization of data-poor chemicals
Deepwater Horizon • Oil Exploration Platform Explodes April 20, 2010 • Estimated 4.9 million barrels of South Louisiana Crude released • 1.8 million gallons of dispersant used • 1072K surface; 771K subsea • Corexit 9500A (9527 early in spill) • EPA Administrator call for less toxic alternative • Verification of toxicity information on NCP Product Schedule • ORD involvement in assessments of dispersant toxicity
EPA Toxicity Studies • Phase I: Dispersant toxicity • Acute toxicity: fish and invertebrate • Comparison to toxicity info from NCP Product Schedule • Human cell line cytotoxicity • in vitro estrogenicity, androgenicity • Phase II: Oil & oil-dispersant mixture toxicity • Acute toxicity: fish and invertebrate • Oil-only • Dispersant+oil • In vitro assays were not used in this phase
What is a dispersant? • Complex mixture • Proprietary / Confidential Business Information • Hydrocarbon component • Breaks up clumps of oil • Like kerosene • Detergent / surfactant component • Solubilizes oil components into water • Water • Colorants • Stabilizing agents
Goals of the NCCT Oil Dispersants Project • Test 8 candidate dispersants for endocrine (ER, AR, TR) activity • Driven by fact that some dispersants contain nonylphenol ethoxylates, known ER agonists • Evaluate relative cytotoxicity • Look for other types of bioactivity using broad in vitro screen • Return analysis in ~6 weeks
Assay Technologies Used • NCCT Assay Goals: • Have collection of assays that can be run on thousands of chemicals • Willing to sacrifice some level of accuracy for throughput • Use: prioritization of large number of previously untested chemicals • Competitive binding (Novascreen) • Cell-free • Human, mouse, bovine • ER/AR reporter-gene assays (NCGC) • Agonist and antagonist mode • Quantitative Cytotoxicity • Collection of 81 nuclear-receptor-related assays (Attagene) • Includes AR, ER, TR • Other xenobiotic response pathways • Quantitative cytotoxicity and cell-stress readouts • HepG2 cells – limited biotransformation capability
Dispersant Cytotoxicity Results Attagene: HepG2 NCGC: Bla ER/AR NHEERL RTP: T47D, MDA, CV1 NHEERL Gulf Breeze: M. Berylina (silverside minnow) A. Bahia (brine shrimp) Significantly more cytotoxic (statistically but not biologically) Less potent More potent Bottom line: no significant difference across products
In vitro assay issues to watch for • All assays have some false positives / false negatives • Assay-specific filtering can help eliminate false positives • Using multiple assays can mitigate problem of false negatives in any one assay • Example: Attagene – use cell-stress assays to filter out false positives • 339 chemicals tested • 127 showed some indication of ER activity in one or both ER assays • 75 showed activity above cell-stress threshold in one or both ER assays • 20 were active above cell-stress level in both ER assays – mostly known positives ER assays
Concentration-Response Profiles for ER in test samples Estradiol and Nonylphenol compounds ERa.T=Attagene ERa TRANS ERE.C=Attagene ERa CIS CIS Efficacy less than half TRANS efficacy for reference compounds Dispersant Positives TRANS assay efficacy near detection threshold for these dispersants
Dispersant Endocrine Assay Results • No AR activity (after discounting false positive) • Weak ER activity seen for 2 dispersants in one ER assay • Nokomis 3-F4 • ZI-400 • Both of these (probably) contain nonylphenol ethoxylates • Nokomis web site said they have alternative formulations without NPE, implying standard formulation includes NPE
Biological Pathway Results for Dispersants Multi-assay pile-up Indication of generalized cell stress Prelude to cytotoxicity Xenobiotic metabolism Estrogen Receptor Activity Less potent More potent Bottom line: 2 products show weak estrogen activity “Not Significant Biologically”
Dispersant Conclusions • Weak evidence of ER activity in 2 dispersants • Seen in single, perhaps over-sensitive assay (1 of 6) • Not of biological significance • Consistent with presence of NPE • Activity only at concentrations >> seen in Gulf after dilution • No AR activity • No ER activity seen in Corexit 9500 • Corexit is in the middle of the pack for cytotoxicity • No worrisome activity seen in other NR assays
Thank You for Listening judson.richard@epa.gov