Download
1 / 52
530 likes | 707 Views
The use of Informatics Approaches in Cheminformatics. Alexander Tropsha Laboratory for Molecular Modeling, UNC Eshelman School of Pharmacy. Overview of Current Projects Background on Cheminformatics

E N D
The use of Informatics Approaches in Cheminformatics Alexander Tropsha Laboratory for Molecular Modeling, UNC Eshelman School of Pharmacy
Overview of Current Projects Background on Cheminformatics Examples of Application Projects: Data Retrieval Modeling Testable Hypothesis Generation Validation OUTLINE
C-C=C-O > Database of compounds (with their measured activities for multiple targets) > Tools to visualize and navigate into chemical space.
D E S C R I P T O R S Physico-Chemical properties (logS, BP, MP, logK etc.) Biological activities Structure-Activity Relationships (SAR) modeling
Computational Chemical Biology C-ChemBench / CECCR project Complementary Ligands Based on Receptor Information (CoLiBRI)
Computational Chemical Biology Protein Structure-Function relationships modeling Simplicial Neighborhood Analysis of Protein Packing (SNAPP)
Activity/Function prediction for molecules Empirical Rules/Filters Similarity Search Consensus QSAR models VIRTUAL SCREENING ~102 – 103 molecules ~106 – 109 molecules
Activity/Function prediction for molecules Protein-ligand recognition
Cheminformatics and Structural Bioinformatics Selected Models Descriptors and QSAR approaches (modeling techniques, applicability domain definitions etc.)
Cheminformatics and Structural Bioinformatics Tools for chemical data mining Tetrahymena Pyriformis Computational Chemical Toxicology
The Laboratory for Molecular Modeling Principal InvestigatorAlexander Tropsha Research ProfessorsClark Jeffries, Alexander Golbraikh, Hao Zhu, Simon Wang, M. Karthikeyan Graduate Research AssistantsChristopher Grulke, Nancy Baker, Kun Wang, Hao Tang, Jui-Hua Hsieh, Rima Hajjo, Tanarat Kietsakorn, Tong Ying Wu, Liying Zhang, Melody Luo, Guiyu Zhao, Andrew Fant Postdoctoral Fellows Georgiy Abramochkin, Lin Ye, Denis Fourches Visiting ResearchScientistsAchintya Saha, Aleks Sedykh, Berk Zafer MAJOR FUNDINGNIH - P20-HG003898 (RoadMap) - R21GM076059 (RoadMap) - R01-GM66940 - GM068665 EPA (STAR awards) - RD832720 - RD833825 Research ProgrammerTheo Walker System AdministratorMihir Shah Adjunct MembersWeifan Zheng, Shubin Liu
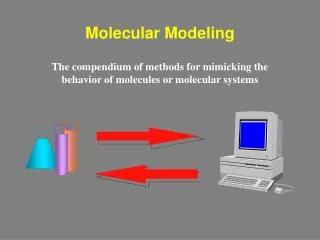
toxicity prioritization & screening environmental toxicity screening What is Chemoinformatics? Dr. Frank Brown introduced the term “chemoinformatics” in the Annual Reports of Medicinal Chemistry in 1998: “The use of information technology and management has become a critical part of the drug discovery process. Chemoinformatics is the mixing of those information resources to transform data into information and information into knowledge for the intended purpose of making better decisions faster in the area of drug lead identification and organization” In fact, Chemoinformatics is a generic term that encompasses the design, creation, organization, management, retrieval, analysis, dissemination, visualization and use of chemical information. http://www.bioinfoinstitute.com/chemoinfo.htm Slide courtesy of Ann Richard
NIH’s Molecular Libraries Initiative in numbers NIH Roadmap Initiative Molecular Libraries Initiative ECCR (6) Exploratory Centers Predictive ADMET (10) PubChem (NLM) 4 Chemical Synthesis Centers MLSCN (9+1) 9 centers 1 NIH intramural 20 x 10 = 200 assays CombiChem Parallel synthesis DOS 4 centers + DPI 100K – 1M compounds • Current SAR matrix • (as of May 25, 2007): • - 256 different MLSCN bioassays • over 140,000 chemicals • 29,558 compounds categorized as “active” in at least one MLSCN bioassay Expected 1M compounds 200 assays
increasing complexity increasing uncertainty SAR structure-activity relationships increasing relevance to RA Chemocentric view of biological data Toxicity Risk Assessment
2D Substructure Searching Quantitative Structure-Activity relationships (QSAR) 2D Similarity Searching Pharmacophore mapping 3D Substructural Searching Docking Molecular modeling Decision trees Molecular Diversity Analysis Neural Networks Quantum mechanical Virtual Screening Graph theory Cluster analysis Data Mining Semiempirical Molecular mechanics Multiple linear regression Principal components analysis Inductive logic reasoning ADMET Genetic algorithms Scoring functions Property filtering Active Analog Drug-likeness Free-Wilson Hansch • Pharmaceutical Sciences • Drug Discovery • Chemical Design • Materials Science • Green Chemistry • Agricultural • Pesticides • Food Science • Polymers • Atmospheric chemistry • Environmental Studies • Green Chemistry • Predictive Toxicology
Largefraction are confirmed actives Key point: Focus on Externally Validated Predictions External database/library SAR dataset Input Cheminformatics Magic Small numberof computational hits Output Real Test
Cheminformatics Analysis of Assertions Describing Drug-Induced Liver Injury in Different Species In Collaboration with BioWisdom, UK
Drug Induced Liver Injury (DILI) is one of the major causes of drug toxicity, both during clinical development and post-approval Animal studies, and clinical trials on limited populations, are used to establish drug safety; both appear insufficient A wealth of published information that could deepen our understanding the mechanisms of DILI is available, but the information is scattered in distributed published works, using inconsistent language Background
An industry-sponsored initiative that embraces the expertise of it’s pharmaceutical members and other stakeholders to build the world's most comprehensive intelligence resource for use in improving drug safety assessments. The Safety Intelligence System The largest forever-expanding collection of known effects of chemicals occurring in the different tissue, drugs effects on clinical biomarkers of tissue injury and drug molecular mechanisms. Facts (assertions) derived from: Biomedical literature Regulatory documents: EMEA EPARs, FDA NDAs Label Data And many more… Introduction to the Safety Intelligence Program (SIP) 5,700 pathologies 8,500 compounds 192,000 facts 1 interface
Structured Data Sources e.g, GO, UMLS, SWISS_PROT Unstructured Data Sources e.g, Medline, Patents, FDA SBAs Noun Phrase Discovery Raw Assertion Discovery Relationship Discovery User Defined Term List Relations Typing Semantic Normalisation Chemistry Canonicalisation Public Domain Sources Licensed Sources Proprietary Sources Intelligence Network Build Process Meta-Search Sofia Terminology & Ontology Data Source Descriptors Structured Data Loader Spiders Concept Maps Selected Corpus Automated Assertion Generation Pass QA QA Fail Pass DocView (manual validation) Intelligence Network Pass Slide courtesy of Julie Barnes, Biowisdom
The Safety Intelligence System contains comprehensive assertional meta-data describing >5,800 effects of >8500 compounds in the liver E.g. ‘Acetaminophen INDUCES Hepatocyte Death (mouse)’ (pathological effect) E.g. ‘Prednisolone SUPPRESSES Collagen Synthesis (human)’ (physiological effect) A subset of the above assertional meta-data, referenced by MEDLINE or the EMEA EPARs, were exported from the Safety Intelligence System for analysis The data were restricted to therapeutic products only The compounds were assigned to human, rodent or non-rodent groups according to the species in which the effect was reported The concordance of drug-induced liver effects across humans, rodents or non-rodents was determined Species Concordance Study Design
14,600 assertions, 1061 compounds Large data set – lending itself to quantitative analyses Non-rodent data are less well represented than human and rodent Species Concordance of Drug-Induced Liver Effects: Assertions Evidenced by MEDLINE
Objectives Can we employ cheminformatics approaches to validate assertions of drug-induced liver effects in different species? Can we identify chemotypes that define species-specific liver effects? Can we establish chemistry driven rules for concordance (or lack thereof) between chemical effects on humans vs. non-humans?
BioWisdom Safety Intelligence System Primary data sources Assertional meta-data generated using SofiaTM platform Assertion refinement Assertion export Chemical curation, fragment analysis & QSAR SIP Members Project Workflow
Used assertions evidenced by MEDLINE, rather than EMEA EPARs, because of their greater quantity Used rodent and human data to build the model (knowing that non-rodent data are sparse in MEDLINE) Used non-rodent data (where a liver effect was observed) to validate the model Study Design
Curation of Chemical Data Step 1 : all inorganic molecules have been removed, as well as those having no available SMILE strings. (993 of 1061 molecules remaining) Examples: Zinc chloride Cl[Zn]Cl Ferrous sulfate [Fe+2].[O-]S(=O)(=O)[O-] Sulfur [S] Cobalt dichloride [Cl-].[Cl-].[Co+2] Manganese chloride [Cl-].[Cl-].[Mn+2] Activated charcoal C cis-Diaminedichloroplatinum [NH4+].[NH4+].[Cl-].[Cl-].[Pt+2] Step 2 : 2D structures were obtained from the SMILE strings, using JChem software from ChemAxon. Then, all counter-ions have been removed and molecules have been neutralized, using ChemAxon Standardizer. (+aromatization, +normalization of nitro groups) (989 compounds remaining) Example: Na+ Step 3 : manual molecular cleaning to correct some structures and to remove compounds with non-sensible SMILES or duplicates (951 of 1061 molecules remaining)
Data transformation for the revised Venn diagram Species profile for each compound (951) was retrieved from the original data automatically with a program written in Delphi. only only only For the cheminformatics analysis, we assumed that each compound has been tested in all species, i.e., humans, rodents and non-rodents. “1” = known liver effect “0” = no liver effect
The Venn Diagram of the Curated Dataset HUMAN (650) RODENT (685) 292 236 257 110 12 26 18 Total number of compounds: 951 NON-RODENT(166)
1. Clustering of compounds in the chemistry space* C*C*C-C=O Calculation of fragment descriptors C*C-C=O C-C=O C-C C=O C*C Sequences of Atoms/Bonds Inputs for clustering algorithm *ISIDA is developed in the group of Prof. A Varnek, Univ. of Strasbourg.
1. Clustering of 951 compounds in the chemistry space For cluster analysis we used fragment descriptors, hierarchical algorithm, Euclidean similarity between compounds, and a complete linkage between clusters. Small clusters identified with high levels of similarity between compounds.
1. Clustering of compounds in chemical space Example 1: Barbiturate derivatives; sedation/anaesthesia a b c d ID = 45 HUMAN = 0 RODENT = 1 NON-RODENT = 0 ID = 76 HUMAN = 0 RODENT = 1 NON-RODENT = 0 ID = 93 HUMAN = 0 RODENT = 1 NON-RODENT = 0 ID = 543 HUMAN = 0 RODENT = 1 NON-RODENT = 0 Example 2: a = cladribine, b = clofarabine, c = cordycepin; all anticancer drugs a b c ID = 201 HUMAN = 1 RODENT = 0 NON-RODENT = 0 ID = 208 HUMAN = 1 RODENT = 0 NON-RODENT = 0 ID = 223 HUMAN = 0 (???) RODENT = 1 (???) NON-RODENT = 0
1. Example 1: Assessing potential data gaps d b c a Allobarbital HUMAN = 0 RODENT = 1 NON-RODENT = 0 Aprobarbital HUMAN = 0 RODENT = 1 NON-RODENT = 0 Barbital HUMAN = 0 RODENT = 1 NON-RODENT = 0 Methohexital HUMAN = 0 RODENT = 1 NON-RODENT = 0 • Recent mining of MEDLINE did not identify any evidence for these compounds having human liver effects • Basic searches in google (e.g. barbital, human, hepatotoxicity) did not reveal evidence for these compounds having human liver effects • The apparent lack of human liver effects may be due to these compounds being used for sedation/anaesthesia where lower doses and shorter exposures may be used than in animal studies
Recent mining of MEDLINE did not identify any new evidence for 2a and b having rodent liver effects Recent mining of MEDLINE did identify an effect of c in a human hepatocellular cell line 1. Example 2: Assessing potential data gaps a c b Cladribine HUMAN = 1 RODENT = 0 NON-RODENT = 0 Clofarabine HUMAN = 1 RODENT = 0 NON-RODENT = 0 Cordycepin HUMAN = 0 (???) RODENT = 1 (???) NON-RODENT = 0 • However, EMEA EPAR data in the Safety Intelligence System did identify b as having rodent liver effects (no rodent liver effects identified for a)
1. Clustering of compounds in chemical space Example 3: a. amiodarone (antiarrhythmic agent), b. benzarone (used for treatment of peripheral vascular disorders), c. benzbromarone (uricosuric agent, used for gout), d. benziodarone (vasodilator). b a ID = 98 HUMAN = 1 RODENT = 1 NON-RODENT = 0 ID = 60 HUMAN = 1 RODENT = 1 NON-RODENT = 1 c d Does this compound lack human liver effects ? ID = 100 HUMAN =0 RODENT = 1 NON-RODENT = 0 ID = 99 HUMAN = 1 RODENT = 1 NON-RODENT = 0
Recent mining of MEDLINE did not identify any new evidence for 3d having human liver effects 1. Example 3: Assessing potential data gaps Does this compound lack human liver effects ? Benziodarone HUMAN = 0 RODENT = 1 NON-RODENT = 0 d • However, a basic search in google (e.g. benziodarone, human, hepatotoxicity) did reveal that the drug caused hepatotoxicity in humans (inferred)
1. Clustering of compounds in chemical space Example 4: Estrogen-like compounds Estradiol ID = 329 HUMAN = 1 RODENT = 1 NON-RODENT = 1 b 2-methoxyestradiol ID = 8 HUMAN = 1 RODENT = 1 NON-RODENT = 0 a Estrone ID = 333 HUMAN = 1 RODENT = 1 NON-RODENT = 0 d Estriol ID = 332 HUMAN = 0 RODENT = 1 NON-RODENT = 0 c Ethinyl estradiol e ID = 338 HUMAN = 1 RODENT = 1 NON-RODENT = 1
Recent mining of MEDLINE and a basic search in google (e.g. estriol, human, hepatotoxicity) did not identify any new evidence for estriol (c) having human liver effects 1. Example 4: Assessing potential data gaps c Estriol HUMAN = 0 RODENT = 1 NON-RODENT = 0
1. Clustering of compounds in chemical space Some clusters have been identified in which compounds share highly molecular structures and also, toxicity profiles for H, R and NR. This information is highly important to identify chemotypes that define species-specific DILI effects. However, in some clusters, similar compounds appear to display different toxicity profiles. These cases may correspond to missing or unreported data, and highlight areas for gap-spotting or additional experimental investigation.
2. Analysis of chemical fragment distribution RODENT ONLY HUMAN ONLY A B Compounds found to show liver effects for humans only Compounds lacking liver effects for humans Are there some differences in fragment distributions between compounds displaying human vs. rodent specific effects?
STRUCTURE REPRESENTATION Viewed by computers Viewed by chemists Viewed by another molecule naphtalen-1-amine
Graphs are widely used to represent and differentiate chemical structures, whereatoms are verticesand bonds are expressed as edges connecting these vertices. MOL File Vertices Molecular graphs allow the computation of numerous indices to compare them quantitatively. Edges Molecular descriptors
2. Analysis of fragment distributions within sets A and B Fragment type Fragment type FA FB ΔF FA FB ΔF C-N-C 71.6 49.0 22.6 C-C-C-N-C 50.0 28.0 22.0 C-C-C-N 58.9 37.4 21.5 C-C-N-C 64.0 43.6 20.4 C-C-N-C-C 39.8 20.6 19.2 C-N 86.4 67.7 18.7 C-C-N 76.3 59.1 17.1 C-N-C-C-N 24.2 7.8 16.4 C-C-C-N-C-C 30.9 15.2 15.8 C-N-C-C-N-C 21.2 5.8 15.3 N-C-C-N 24.6 9.7 14.8 C*N 35.2 20.6 14.5 C*C 80.1 66.1 13.9 C-C-N-C-C-O 22.0 8.6 13.5 C-C-N-C=O 29.2 16.0 13.3 C*C*N 33.1 19.8 13.2 C-C-N-C-C-N 18.6 6.2 12.4 S-C 23.3 10.9 12.4 C-C-N-C-C-N-C 17.8 5.8 12.0 C-S-C 15.3 3.5 11.8 C-N-C-C-O 29.2 17.5 11.7 C-N-C=O 37.7 26.1 11.6 C*C*C*C 70.8 59.1 11.6 C-S-C-C 13.6 1.9 11.6 C-C-N-C-C=O 17.4 5.8 11.5 O-C-C-N-C=O 15.7 4.3 11.4 C=C-N 15.3 3.9 11.4 C-N-C-C=O 19.9 8.6 11.4 C-N-C=C 14.0 2.7 11.3 C*C*C 75.0 63.8 11.2 C-C-C 86.9 75.9 11.0 N-C-C-N-C-C-O 12.7 1.9 10.8 C-C-C=O 47.9 37.4 10.5 O=C-C-N-C=O 15.7 5.4 10.2 C-C-C-N-C-C-N 14.8 4.7 10.2 S-C-C 14.4 4.3 10.1 N-C=O 42.8 32.7 10.1 C*C*C*N 23.3 13.2 10.1 C*N*C 29.7 19.8 9.8 C-C-C-C-N 33.1 23.3 9.7 C-C-C-N-C-C=O 13.1 3.5 9.6 N-C*N 15.7 6.2 9.5 C-C=C-N 12.7 3.5 9.2 N-C-C-N-C-C=O 11.4 2.3 9.1 C=C-C-O 14.4 5.4 9.0 C-C-C-N-C-C-C 14.4 5.4 9.0 C-C=C-N-C 11.4 2.7 8.7 S-C-C-C 11.4 2.7 8.7 N-C-C=O 20.8 12.1 8.7 C-C-C-C-N-C 27.1 18.7 8.4 C-C*N 17.4 8.9 8.4 Etc. FA = Fragment Frequency (%) for (Human Only – 236 compounds) FB = Fragment Frequency (%) for (Rodent Only – 257 compounds)
2. Differential fragment frequency distribution FA = Fragment Frequency in A FB = Fragment Frequency in B ΔF = ( FA - FB)
3. Binary QSAR based classification Class A (248) Class B (283) RODENT ONLY HUMAN ONLY Compounds NOT affecting liver in humans Compounds known to affect liver in humans only Can we predict the compound class from its structure only ?
Principle of QSAR/QSPR modeling D E S C R I P T O R S Quantitative Structure Property Relationships Introduction C O M P O U N D S 0.613 0.380 -0.222 0.708 1.146 0.491 0.301 0.141 0.956 0.256 0.799 1.195 1.005 P R O P E R T Y
Principle of QSAR/QSPR modeling C O M P O U N D S P R O P E R T Y D E S C R I P T O R S Quantitative Structure Property Relationships Introduction 0.613 0.380 -0.222 0.708 1.146 0.491 0.301 0.141 0.956 0.256 0.799 1.195 1.005
3. QSAR based classification Using SUPPORT VECTOR MACHINES (SVM) Accuracy (%) = (number of compounds correctly predicted )/(total number of compounds) Modeling set 5 fold CV Modeling set Accuracy External set Accuracy Fold Descriptors Model ID 1 62.3% 88.2% 71.0% 217 62.9% 77.6% 67.3% 162 fragments Dragon 2 64.9% 81.2% 64.2% 112 67.5% 81.2% 55.7% 197 fragments Dragon 3 62.4% 91.3% 64.2% 194 65.2% 91.1% 61.3% 198 fragments Dragon 4 64.9% 99.3% 72.6% 208 62.1% 84.9% 68.9% 151 fragments Dragon 5 63.3% 82.6% 68.9% 205 61.9% 94.4% 70.8% 175 fragments Dragon NB: Preliminary results; could be improved.
3. QSAR based classification Class A (248) Class B (283) RODENT ONLY HUMAN ONLY 18 EXTERNAL SET (18 compounds reporting no liver effects in humans or rodents) QSAR MODELS