Download
1 / 24
240 likes | 370 Views
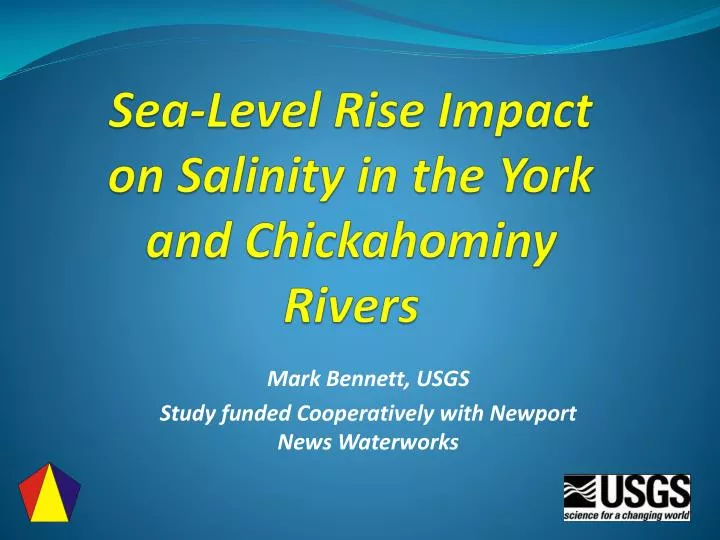
Sea-Level Rise Impact on Salinity in the York and Chickahominy Rivers. Mark Bennett, USGS Study funded Cooperatively with Newport News Waterworks. Acknowledgements. Presentation derived primarily from study entitled:

E N D
Sea-Level Rise Impact on Salinity in the York and Chickahominy Rivers Mark Bennett, USGS Study funded Cooperatively with Newport News Waterworks
Acknowledgements Presentation derived primarily from study entitled: “Simulated Changes in Salinity in the York and Chickahominy Rivers as a Result of Projected Sea-Level Rise in the Chesapeake Bay” Karen C. Rice, Mark R. Bennett, and Jian Shen
Peninsula Water Supply • NN Waterworks - Chickahominy River, five reservoirs, & desalted groundwater (62 mgd) • Williamsburg – one reservoir; interconnections • JCC & York County: groundwater; interconnections • Regional sharing Agreements
Chickahominy River • Primary source of fresh water to the region • Limited source during droughts due to low flows and salinity • Tidal barrier dam designed/installed in 1940’s
Climate Adaptation Planning Warming impacts on surface water quality Drought Intensity and frequency changes Demand Patterns (including population shifts and seasonal peaking changes) Sea Level Rise, Storm Surge, Salinity Gradients
Scenarios Modeled Normal and drought flow conditions in York and Chickahominy River Low, Median, and High Sea-level Rise Scenarios 1. 20th Century rate = 3-4 mm/year; 30-40 cm by 2100 2. 2oth Century rate + 2 mm/year acceleration; up to 50 cm by 2100 3. 20th Century rate + 7 mm/year acceleration; up to 100 cm by 2100
Chickahominy Model Results • Model development, testing and calibration by VIMS and USGS • Adapted Chesapeake Bay model and river models (HEM-3D)
Chickahominy Model Results Calibration Results
Chickahominy Model Results • Surface salinity at Walkers Dam on the Chickahominy River • 3 documented historical events • 30 cm rise increases duration slightly, increases concentration significantly
Chickahominy Model Results Higher sea-level conditions increase number of excursions during lower flow periods ( 7-8 events !)
Chickahominy Model Results October 2005 flow conditions (“normal dry season/year”)
Chickahominy Model Results October 2002 flow conditions (Severe Drought)
York River Model Results October 2005 flow conditions (“normal dry season/year”)
York River Model Results October 2002 flow conditions (severe drought)
Summary Sea-Level rise will impact the freshwater-salt water – brackish water gradients in the York River and Chickahominy River. Changes will be most notable during low flows and in areas with a lower volume of flow What are the potential implications for habitat?
Questions ? http://pubs.usgs.gov/of/2011/1191/ Quality. Reliability. Community.